Offizieller Lieferant
Als offizieller und autorisierter Distributor beliefern wir Sie mit legitimen Lizenzen direkt von mehr als 200 Softwareherstellern.
Sehen Sie alle unsere Marken.

Bildschirmabzüge: Add custom data and measurements as context info for the analysis. 0 ...
Merkmale: and Network I/O can be used to analyze interesting time ranges. Weight: 0 Customer‘s Own Custom Data Provider Hierarchical configuration and efficient low impact business data tracing. Weight: 0 UserMarks API ...

Bildschirmabzüge: Use the tool "SpeedTraceTool" and job definition file to control recording and analysis. 0 ...

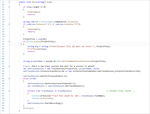
Bildschirmabzüge: Programmatically perform trace analysis. 0 ...

Bildschirmabzüge: Programmatically control the recording of apps. 0 ...
Versionshinweise: merged profiles. Extended Automation API (recording and analysis). Improved network capture. Performance optimizations have been made in 'TraceAnalyzer' Async event processing. Performance ...
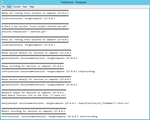
Merkmale: Integrate Development Cycle Weight: 0 How to Record via.NET API Programmatically control the recording of apps. Weight: 0 How to Analyze via API Programmatically perform trace analysis. Weight: 0 Command ... SpeedTrace Pro provides a special test automation interface though which you can set up your own testing environment to trace and profile across networks and throughout the Internet. Testing ... Line Interface Use the tool "SpeedTraceTool" and job definition file to control recording and analysis. Weight: 0 ...

Merkmale: Before applying actual code changes the SpeedTrace user can perform simulations to find out how the planned modifications would affect the overall performance. Simply specify the speed up factor ...