Offizieller Lieferant
Als offizieller und autorisierter Distributor beliefern wir Sie mit legitimen Lizenzen direkt von mehr als 200 Softwareherstellern.
Sehen Sie alle unsere Marken.
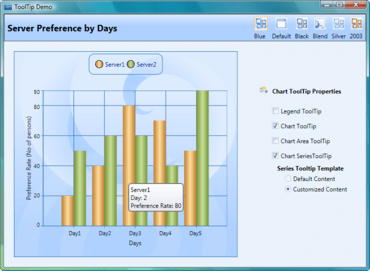
Syncfusion Essential Chart is a business-oriented charting component which offers an innovative data object model that makes it easy to populate a chart with any kind of data source. Syncfusion Essential Chart features an advanced styles architecture that simplifies complex multilevel formatting. It can handle data in different ways. You can add data points to a series and let the chart manage them. Alternatively, you can achieve easier data binding to a data set using the built-in ChartDataBindModel control, and you can specify column names containing the x- and y-coordinate values. For additional flexibility, you can implement the IChartSeriesModel interface and plug-in a custom model. Syncfusion Essential Chart includes components for Windows Forms, ASP.NET, ASP.NET MVC, Silverlight and WPF platforms.
Syncfusion Essential Chart is also available as part of Syncfusion Essential Studio User Interface Edition and Syncfusion Essential Studio Enterprise.
Syncfusion, Inc. is a leading provider of enterprise-class software components and tools for the Microsoft .NET platform. With Syncfusion, developers can move beyond simply coding applications to delivering business innovation - the elegant user interfaces, business intelligence dashboards, and sophisticated reporting that today's business users need, in the formats they demand. Syncfusion's award-winning .NET components and controls are designed to grow with you, whether you're using Windows Forms, WPF, ASP.NET, ASP.NET MVC or Silverlight.

Add charts to your .NET applications.
Live-Chat mit unseren Syncfusion-Lizenzierungs-Spezialisten.