Nevron Chart for SSRS improves axis annotations

Version 2011.1 also optimizes speed and memory usage and improves legend layouts.
6月 7, 2011
功能发布

Nevron Chart for Reporting Services (SSRS) is an advanced report item, which delivers a complete set of 2D and 3D charting types, highly customizable axes, tight data integration, visual effects and additional customization properties to your reports. Designed to enhance SQL Server Reporting Services, it also improves your report authoring experience, with its polished visual editors, refined settings and well-organized structure. Nevron Chart for SSRS is an indispensable tool for any serious Business Intelligence, Scorecard, Presentation, Scientific or general purpose report. The product introduces advanced Axis Features, numerous XY and XYZ scatters, Surface Charts, many customization properties, seamless integration with SQL Server Reporting Services 2005 and 2008, Photoshop-like effects, HTML-like rich-text formatting much more.

Updates in 2011.1

  • Optimized speed and memory usage - The Chart control document building and rendering has been completely revised. As a result it provides significant speed improvement in both the designer and server components
  • Non-overlapping Data Labels Layout - All Cartesian charting types now support automatic data labels layout. The data labels layout prevents labels from overlapping in both ordinal and scatter charts and works in 2D and 3D appearance modes
  • Improved Axis Annotations - The Chart axes have been extended to support Const lines with texts as well as Const ranges
  • Axis Orientation - All Cartesian axes now support the axis orientation feature
  • Improved XML Formatted Texts - The XML formatted texts feature is extended to support additional XML tags that allows you to specify the text background and border
  • Dynamic Size - The Chart report item size can be modified at runtime through SSRS expressions
  • Line and Point Series Sampling - The Line and Point charting types support options for automatic data resampling. This allows for the visualization of very large datasets
  • Legend Layout improvements - The Chart legend now supports Vertical and Horizontal Wrapping
  • New Charting Feature - The Area, Line, Pie, Error Bar, Step Line, Point and Surface charting types have additional features

About Nevron

Nevron, founded in 1998, has become a global leader in component based data visualization technology for a diverse range of Microsoft centric platforms. Built with perfection, usability and enterprise level features in mind, their components deliver advanced charting, digital dashboards and diagrams that are not to be matched. Today Nevron components are used by many Fortune 500 companies and thousands of developers and IT professionals worldwide.
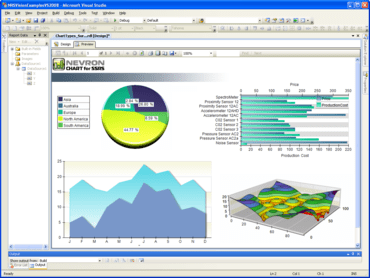
Charts displayed in Reporting Services.

Nevron Vision for SSRS

用 SQL Server Reporting Services 为您的报告项目提供先进的数据可视化技术。

有任何疑问吗?

透过Live Chat与我们的Nevron 专家联络!