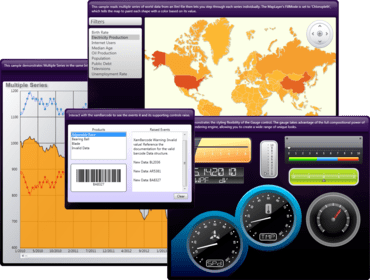
NetAdvantage for WPF Data Visualization 2011 Volume 1 also adds new pie chart control and barcode reader.
Juni 10, 2011
Veröffentlichung mit neuen Funktionen
Infragistics NetAdvantage for WPF Data Visualization includes stylable user interface controls for geospatial mapping, interactive gauges, graphical timelines, animated charting and OLAP pivot grids. Infragistics NetAdvantage for WPF Data Visualization includes charts, gauges and tree maps that handle millions of data points with millisecond updates. These WPF data visualization controls let you communicate information clearly by leveraging the superior graphics capabilities of WPF. Use the fully-featured UI controls to produce high-end OLAP pivot grids, charts, maps, gauges, timelines, bullet graphs, barcodes and more. Built-in analytics for statistical and technical studies add value that decision-makers can act on immediately.
Updates in 2011 Volume 1
- IG Theme – NEW! - The IG Theme was created to allow application developers a complete visual theme, so modern applications can be created without having to rely on the Microsoft Office brand.
- xamPivotGrid - Enhanced! - This release of the WPF OLAP pivot grid lets you connect with more data, more easily with support for XMLA with Oracle databases. You can enable the pivot grid to let end users edit the contents of its cells, expand and collapse the data shown in the pivot grid, and limit expansion or contraction of data specifically to the group in which the “+/-“ is clicked, rather than all groups within the pivot grid. Columns are now sortable. You can also now customize the data selector display for flat data sources, the definition of calculating rows and columns, and handle an event when a header cell is clicked.
- xamDataChart™ Enhanced! - Added these additional types of data series and chart types:
- Bubble chart
- Polar Scatter series
- Polar Spline Area series
- Radial Area series
- Radial Column series
- Radial Line series
- Radial Pie series
- Radial series
- xamPieChart - NEW! - A new WPF pie chart control that’s visually appealing and extensible. Create simple or exploded pie charts, with a customizable threshold for inclusion in an “Other” category, and text labels and images that can be displayed within or outside of the pie in a manner that avoids overlapping. Users can click or drill down to view underlying data, explode out a section of the pie, and get information via tooltips.
- xamBarcodeReader - NEW! - Now you can read and decode barcode images, with support for identifying the following barcode symbologies:
- QR Code
- EAN/UPC
- Code 39
- Code 128
- MaxiCode
- Interleaved 2 of 5
- xamBarcode - Enhanced! - Your application’s QR Codes can now transform ECI numbers.
- xamOrgChart - NEW! - Create high performance, stylable, hierarchical organization charts that represent company, department or workgroup structures and more. Relationships between employees in different departments can be traced, and groups can be expanded or hidden. You can change the orientation of the organization chart, and customize the types of metadata that are displayed and how they are shown.
- xamNetworkNode - NEW! - The Network Node Diagram control helps you create visual representations of simple or complex network relationships, similar to a cluster diagram in which each node represents a unique data point related through its connectedness to other data points. End users can easily pan and zoom, and you can customize the types of metadata that are displayed and how they are shown.
- Drag and Drop Framework – NEW! -User-friendly drag and drop behaviors are now available with any UI element in your WPF Data Visualization application through the DragDropManager. By defining what drop operations are permissible, you can enforce business rules with little to no coding. Throughout each drag operation there is a channel of events to which your application can listen, empowering you to add your own rich touches like animation. Everything about the look and feel of your drag and drop experience is within your control through the Infragistics Drag and Drop Framework for WPF Data Visualization.
- Make Any UI Element Draggable – You can drag all of your items and drop them onto any targets you define
- Channel Concept – By simply associating your drag sources and drop targets with "channels" you can enforce many constraints; items can only be dropped on sources if their channels are compatible
- Customizable Cursors – You can customize the appearance of the move, copy and "drop not allowed" cursors that appear during a drag operation
- Drop Target Marker – When a suitable drop target is near, Infragistics Drag and Drop Framework draws a stylable, semitransparent marker to indicate this target can accept the item being dragged
- Events – Since drag and drop is about an action taking place, there are many events enabling you to tap into all stages of the operation
- UI Automation – NEW! - Microsoft’s UI Automation accessibility framework enables applications to provide and consume information about user interfaces. Microsoft UI Automation also lets developers build automated test scripts for the UI. Many of the WPF Data Visualization controls are now built with support for Microsoft UI Automation for greater accessibility.
About Infragistics
Infragistics has been a market leader in the presentation layer components industry for over 18 years. With a comprehensive portfolio of multi-platform Enterprise Software products and services, it has achieved global reach in nearly every Fortune 2000 company. Infragistics empowers developers to build and style great application user interfaces for Windows Forms, ASP.NET, WPF and JSF, and additionally offers user interface test tools, support, training and consulting services.
User interfaces built using NetAdvantage for WPF Data Visualization.
Dank der Geschwindigkeit, Skalierbarkeit und Touch-Unterstützung, die Ihnen mit den WPF-Steuerelementen zur Verfügung stehen, behalten Sie die Entwicklung Ihres Unternehmens gut im Griff.
Sie haben eine Frage?
Live-Chat mit unseren Infragistics-Lizenzierungs-Spezialisten.

Offizieller Händler seit 1996
