Essential Studio Business Intelligence updated

View large amounts of data by breaking the data into pages.
2月 6, 2012
功能发布

Syncfusion Essential Studio Business Intelligence Edition includes BI Grid, BI Client, BI Chart, BI Gauge and BI PivotGrid controls to help manage OLAP data. You can also build reports interactively with the included Report Designer.

Updates in 2012

Essential BI Grid

  • Hide Summary Elements - Hide summary elements of an OLAP grid at different levels based on the level name or level number
  • Frozen Headers - Freeze the header of a grid so that headers are always visible when scrolling through a grid

Essential BI PivotGrid

  • Show or Hide Subtotals - Enables users to have an abstract view of data
  • Persist Expand/Collapse State - Maintain the expanded/collapsed state in a PivotGrid control when the pivot schema has changed
  • Disable Grouping by Specific Fields - Restrict users from dragging and dropping certain fields in the grouping area
  • Run-Time Custom Summary Type Setting - Set custom and built-in summaries at run time using the Pivot Computation Information dialog
  • Hide Field Support - Hide unnecessary fields from the pivot schema designer by using the ShowDisplayFields property

Essential BI Client

  • Paging Support - View large amounts of data by breaking the data into pages

About Syncfusion

Founded by industry experts in 2001, Syncfusion provides a broad range of enterprise-class software components and tools for the Microsoft .NET platform. Their award-winning .NET components and controls are designed to meet evolving development needs, whether working in Windows Forms, WPF, ASP.NET, ASP.NET MVC or Silverlight. Syncfusion strive for excellence in order to offer the very best value to customers - from small ISVs to Fortune 100 companies.
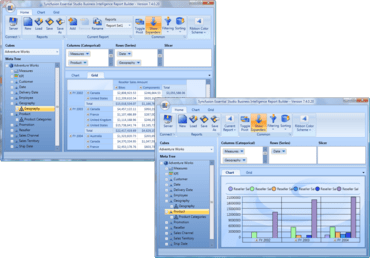
Sample Business Intelligence applications.

Syncfusion Essential Studio Business Intelligence Edition

Easily build powerful analysis interfaces into your .NET applications with gauges, charts, and grids - including pivot grids – that give your users the ability to visualize and make sense of your organization’s data.

有任何疑问吗?

透过Live Chat与我们的Syncfusion 专家联络!