ChartJS adds Sparklines

A compact chart designed to illustrate trends within your data.
12월 5, 2013
기능 릴리스

ChartJS includes HTML5/JavaScript chart and gauge widgets. It helps you create traditional websites, sites that target mobile devices or native apps built with HTML5/JavaScript, and compiled with Adobe Cordova (PhoneGap). ChartJS provides high-performance and elegant data visualization options for all your business intelligence needs.

Updates in 13.2.5

  • VectorMap Widget - Quickly configure a map with markers, tooltips, zooming and centering. Process end-user interaction with the contents of the map.
  • Sparkline Widget - A compact chart designed to illustrate trends within your data. Multiple series types are available for data presentation including line, area, bar, spline, spline area, step line, step area and win/loss.
  • Bullet Widget - A small chart that indicates measured data by a bar and a comparative measure as a target. This widget allows users to visually estimate how close the currently measured value is to the target.
  • Exporter Widget - A panel that can be located anywhere on a page and bound to the dxChart widget so that end-users can easily print the contents of a chart widget or export it to a desired file format.

About DevExpress (Developer Express)

DevExpress (Developer Express) is a software development company based in the United States. It produces coding assistance tools and components for Delphi, C++ Builder and Microsoft Visual Studio developers. The major part of its product line is VCL, .NET WinForms and ASP.NET components that replicate the UI of Microsoft Windows and Microsoft Office applications. Developer Express has won many industry awards for its products.
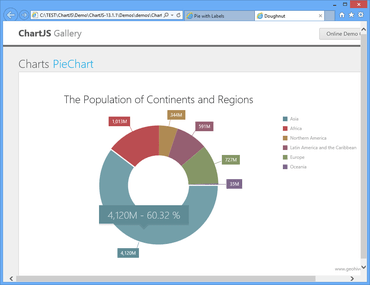
Pie chart created using ChartJS.

DevExtreme Web

동적인 클라이언트 사이드 데이터 시각화.

궁금한 점이 있으세요?

DevExpress 사 제품 라이선스 담당자와 라이브 채팅