FusionCharts Suite XT Improves Chart Rendering

New unified and optimized JavaScript code base works across browsers and devices.
8月 18, 2014
特別功能發表

FusionCharts Suite XT is an industry leading JavaScript charting library that offers a unified experience across all devices and browsers. It can render over 90 charts and gauges in JavaScript (HTML5), along with 965 data-driven maps. Its interactive features such as tool-tips, clickable legend keys, drill-downs, scrolling and zooming, enable a rich user experience for your data-driven applications. FusionCharts Suite XT works well with both XML and JSON data, and can be easily integrated with any JavaScript framework or a server-side technology e.g. ASP.NET, PHP, Python, Java, Ruby on Rails etc. FusionCharts Suite XT comes pre-packaged with extensive documentation, ready-to-use business demos and code samples that allow you to create your first chart in under 15 minutes.

The following individual products are also available:

Updates in v3.4

  • Rendering supported in Javascript only, support for rendering in Flash deprecated.
  • Significant improvement in chart rendering time.
  • Dependency on jQuery removed leading to reduction in JavaScript code footprint.
  • New developer friendly documentation introduced for the JavaScript only API.
  • Theme manager added to allow easy application of presentation features across charts.
  • Annotation engine added to allow addition of text and shapes on charts.
  • Additional events available for deeper integration of charts with applications.
  • Support for hover effect on all common charts.
  • Support for macro variables in tool tips to update content dynamically.
  • Data enabled markers supported for maps.
  • Selectively render axis lines.
  • New JavaScript helper methods added.
  • Cleaner legend keys across all charts.
  • Option to hide specific datasets upon chart initial load.
  • Pie and doughnut charts can now be configured to allow slicing of only one pie/doughnut slice at most.
  • Doughnut charts can now contain a dynamic center label, which can be configured per doughnut slice.
  • Better export server hosted by FusionCharts, for export of charts as image/PDF.
  • Support for palette ThemeColors across the suite.
  • Support for automatic ellipses and wrapping in ZoomLine charts.
  • Anchors in sparkline charts now support the hover effect.
  • New attributes for anchors to better configure their display.
  • Support for tool-tips for the connectors in the Drag Node charts.
  • Support for path in annotations.

About FusionCharts

FusionCharts is one of the industry's leading providers of Enterprise-grade data visualization solutions. 20,000 customers and 450,000 users in 118 countries trust and use FusionCharts products to add delight to their web and Enterprise applications. Their customers include most Fortune 500 companies, the top business intelligence organizations, and some of the web's most popular websites.
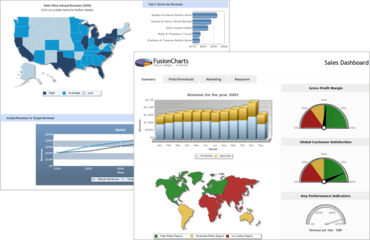
Dashboard elements included in FusionCharts Suite XT.

FusionMaps XT

有效地使用交互式地圖顯示類似收入(按區域)之類的地理資料、選舉結果和辦公地點。

有任何疑問嗎?

Live Chat現在與我們的FusionCharts 專家即時聊天詢問。