Fornitore ufficiale
In qualità di distributori ufficiali e autorizzati, forniamo licenze software legittime direttamente da più di 200 autori di software.
Vedi tutte le nostre marche
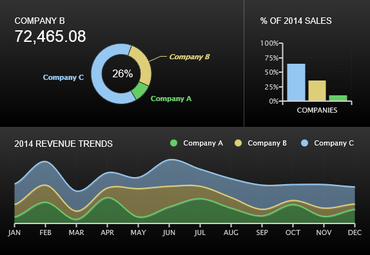
ZingChart includes over 100 chart types and comes with features like zooming and interactive legends to help your users get interactive. You can render ZingCharts charts in any browser or device, and export them quickly and easily. The CSS-like styling allows you to creatively customize your charts.
ZingChart was born in 2008, during the development of a deep web analytics system. They needed to add standard charts to the mix, but existing Flash and canvas based graphing systems couldn't keep up. They kept buckling under the volume of data provided and lacked the required flexibility. One year later, ZingChart was released and it keeps growing in features, flexibility and popularity.

Crea grafici animati e interattivi con centinaia di migliaia di record di dati.
Chatta live con i nostri specialisti di gestione delle licenze di ZingChart ora.