官方供应商
我们作为官方授权经销商,直接提供超过200家开发厂家所发行超过1000个的产品授权给您。
查看我们的所有品牌。
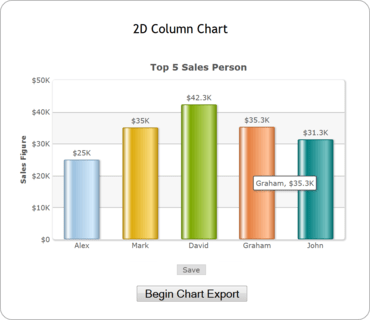
FusionCharts Suite XT is an industry leading JavaScript charting library that offers a unified experience across all devices and browsers. It can render over 90 charts and gauges in JavaScript (HTML5), along with 965 data-driven maps. Its interactive features such as tool-tips, clickable legend keys, drill-downs, scrolling and zooming, enable a rich user experience for your data-driven applications. FusionCharts Suite XT works well with both XML and JSON data, and can be easily integrated with any JavaScript framework or a server-side technology e.g. ASP.NET, PHP, Python, Java, Ruby on Rails etc. FusionCharts Suite XT comes pre-packaged with extensive documentation, ready-to-use business demos and code samples that allow you to create your first chart in under 15 minutes.
The following individual products are also available:
FusionCharts is one of the industry's leading providers of Enterprise-grade data visualization solutions. 20,000 customers and 450,000 users in 118 countries trust and use FusionCharts products to add delight to their web and Enterprise applications. Their customers include most Fortune 500 companies, the top business intelligence organizations, and some of the web's most popular websites.

跨多个设备和平台使用的 JavaScript (HTML5) 图表和量具。
透过Live Chat与我们的FusionCharts 专家联络!