
AnyChart JS
JavaScript-Diagramme zur Einbettung und Integration.
Veröffentlicht von AnyChart
Wird von ComponentSource seit 2017 vertrieben
Preise ab: $ 136.22 Version: 8.14.1 Letzte Aktualisierung: Jan 19, 2026
JavaScript-Diagramme zur Einbettung und Integration.
Veröffentlicht von AnyChart
Wird von ComponentSource seit 2017 vertrieben
Preise ab: $ 136.22 Version: 8.14.1 Letzte Aktualisierung: Jan 19, 2026

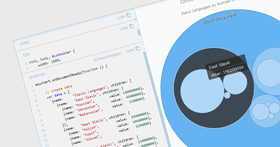
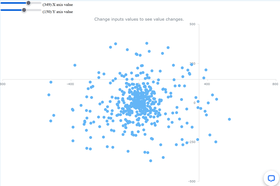
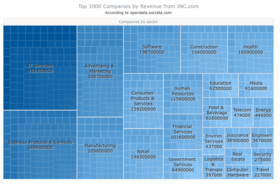
AnyChart JS is a lightweight and robust JavaScript charting library. It makes it easy for developers to integrate beautiful charts into any mobile, desktop or Web product. The component works with any database and runs on any platform, includes more than 60 chart types and provides features to create your own types. It's easy to adjust look and feel of your charts using themes and palettes. AnyChart JS includes set of pre-built sets or you can create your own scheme.


Bild 1 / 42
Erik Gundersen, Director Advanced Products, Rockford Corp.
AnyChart JS Features:


Live-Chat mit unseren AnyChart-Lizenzierungs-Spezialisten.


Tel.: (888) 850 9911
Fax: +1 770 250 6199


