de Developer Express - Tipo de producto: Componente / ASP.NET WebForms / ASP.NET AJAX (ATLAS) / .NET Class / 100% Managed Code / AJAX
ASPxPivotGrid by Developer Express
Add data mining and multi-dimensional analysis to your ASP.NET applications. 
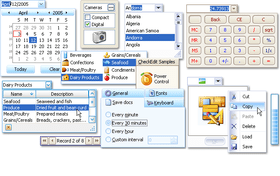
ASPxPivotGrid Suite is a comprehensive data analysis, data mining, and visual reporting solution for ASP.NET 2. With it, your users can break down raw data in any manner they require using easy-to-understand Windows commands. By incorporating the ASPxPivotGrid in your application, you can deliver an almost endless array of reports. ASPxPivotGrid is able to slice and dice information efficiently and provide customers with an intuitive end-user experience. It delivers numerous layout customization options with total end-user control over each individual on-screen report.
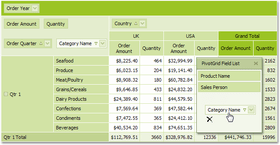
OLAP Data Source Support
Microsoft Analysis Services (OLAP) data sources are now fully supported by the ASPxPivotGrid. If bound to such a data source, a pivot grid control delegates all data management and calculations to the server side. This feature greatly increases your application's performance if you are dealing with a large dataset. In this case, the entire dataset will have to be reloaded with each control update. It is much faster to request server-side data recalculation and then simply display the downloaded result.
Quickly Display Table Data into Fully Customizable Visual Reports
The ASPxPivotGrid Suite is a component library for ASP.NET 2 that allows your end users to slice and dice data in a manner similar to that found in MS Excel. It can convert hard to read and difficult to dissect dataset information into compact and summarized visual reports - making your applications far more usable and more effective at addressing your customer's real-time business analysis needs. And just as important, with the ASPxPivotGrid, users can easily change a report's layout visually in order to examine data from different/multiple perspectives. The benefits of this are two-fold - first, you never again have to foresee all possible report scenarios your end-users might require (saving you time and increasing your productivity) and second, your users will not have to deal with hard to use and overly complex reporting tools to answer their business questions.
Control the Level of Detail
By default, the row and column axes contain each unique value in the source column. With the ASPxPivotGrid, you can quickly simplify a report by merging values. For instance, you might have a report containing survey data in which the respondent's age represents an important characteristic. End-users may not want to browse through each and every unique age and instead want to see the ages of respondents in intervals such as 21-30, 31-40, etc. Instead of viewing sales by each unique date, they may want to view the sales for just the first few months. The axis can be customized in almost any fashion and the most common customizations need only a single property to be modified for its implementation.
Arrange Values Hierarchically - See Raw or Summarized Data in a Single Report
Since the visual control offers your end-users total runtime customization flexibility, not a single report layout needs to be modified to view data at different detail levels. You simply place fields at lower detail levels on the column or row area. Field values are automatically arranged into a tree structure with expandable parents. End-users are free to expand and collapse child groups to see more summarized or raw reports.
Automatic and Manually Specified Totals
Among the many features available in the component library is its ability to display grand totals for each row and column automatically. On the rare occasion that the built-in summary computation engine does not address a specific business requirement, you can display any number of totals for any value group.
Sort Data and Display Top Rows - Easily Access the Most Important Information
The ASPxPivotGrid automatically sorts row and column values so you can easily locate required data. Comprehensive data analysis, however, often requires a two-way approach to data navigation in that you may need to find data by a specific value or find a value by its data. To allow for the latter approach, the ASPxPivotGrid introduces a unique feature - sorting values by their corresponding grand totals. This means the product you'll see first is not the one which starts with an A or Z, but rather the one that has the most or least sales. This of course is just the beginning to more effective and efficient data analysis. You can also specify the number of top rows that are displayed. So you can view a specific number of best-selling or worst-selling products for each year, month, customer, etc. You can concentrate on only the most important information and avoid being overload with a lot of surplus data.
Filter Data - Filter Out the Values Used to Calculate Summaries on the Fly
You will find that with its built-in visual filtering option, your end-users can manipulate reports on the fly using an easy to understand and familiar visual metaphor.
Hide unnecessary values in the axes - Another mechanism that allows end-users to focus only on the most important data
Filter the data against which calculations are based - Allow your end-users manage this capability visually, the ASPxPivotGrid has a Filter Panel Region. This pane was specifically designed to contain fields that aren't currently used in the report, and when required, can be dropped onto the report to automatically alter the base data used in the calculations
What’s new in ASPxPivotGrid Suite v2008 vol 2?
Useful Classes for Client-Side Scripting - a new ASPxClientUtils class allowing you to easily perform typical client-side actions, including the following:
Determine web browser type
Work with arrays
Access an object's parent or child object
Obtain event parameters
Easily Transmit Data onto the Client -All DevExpress AJAX-enabled controls allow you to use callbacks to easily exchange data with the web server. Controls expose a JSProperties property, which allows you to declare custom properties for the client control. You can specify these property values on the server and then access them on the client...as you would with built-in properties.
Enabling/Disabling Controls and Control Elements on the Client Side - Previously, enabling or disabling a control or a particular control element required a round trip to the server. In v2008 vol 2 the ASPxEditors and ASPxperience Libraries allow you to change their enabled state or the state of their elements (e.g., tabs and menu items) on the client side, to reduce the number of round trips and increase web site responsiveness.
Distinguishing Between Callbacks and Postbacks - A new server-side IsCallback property has been added to our web controls. This property enables you to determine whether a control is taking part in callback processing.
What’s new in ASPxPivotGrid Suite v2008 vol 1?
Data Shaping Improvements
Group Values Manually - New Custom Group Intervals feature. With it, you can easily group axis values using your own criteria. Simply handle a specially designed event to compare values and determine whether they need to be within the same group.
Keep Fields Together -Fields can now be grouped so that they are always kept together. This allows you, for instance, to move several fields simultaneously by dragging a single field from a group. Another advantage is the ability to easily show or hide fields using expand buttons in column headers.
OLAP Enhancements - You can now obtain the records that were used to calculate a particular summary. Only a single line of code is required to achieve this objective.
Data Exchange Enhancements
Printing - The ASPxPivotGrid can be printed in both portrait and landscape mode.
Export - In v2008 vol 1 we've implemented new methods that allow you to provide custom names for exported worksheets.
Header Area Visibility - In v2008 vol 1 the ASPxPivotGrid provides new options that control header area visibility. For instance, this allows you to hide column field headers, as shown below. As a result, end-users won't be able to change column header data.
What's new in ASPxPivotGrid Suite v2007?
Complete Callback Support -The ASPxPivotGrid now uses callbacks for all operations, except for those that are done directly on the client side. You can of course continue to use postbacks instead of callbacks - simply toggle a single property.
Embedded Pager - If you are working with large datasets, you can now dramatically increase your application usability by exploiting the PivotGrid's embedded pager. The grid's content will be automatically split across multiple pages based upon a specified page size. The pager can be displayed above, below or on both sides of the grid. You have full control over the embedded pager's appearance and behavior.
PartNumbers: PC-517685-162702 517685-162702 PC-517685-162701 517685-162701
PurchaseOptions: ASPxPivotGrid v2008 vol 2 (V8.2.4) 1 Developer License without Source code - Includes one year subscription , ASPxPivotGrid v2008 vol 2 (V8.2.4) 1 Developer License with Source code - Includes one year subscription
Resources: Read the Developer Express License Agreement, Download the DXperience v2006 Vol3 for Visual Studio 2002/2003 evaluation on to your computer - Expires After 30 Days, Download the DXperience v2008 vol 2 (V8.2.4) for Visual Studio 2005/2008 evaluation on to your computer - Expires After 30 Days
Operating System for Deployment: Windows Vista, Windows XP, Windows 2000
Architecture of Product: 32Bit
Product Type: Component
Component Type: ASP.NET WebForms, ASP.NET AJAX (ATLAS), .NET Class, 100% Managed Code, AJAX
Built Using: Visual C# .NET
Compatible Containers: Microsoft Visual Studio 2008, Microsoft Visual Studio 2005, Microsoft Visual Basic 2008, Microsoft Visual Basic 2005, Microsoft Visual C++ 2008, Microsoft Visual C++ 2005, Microsoft Visual C# 2008, Microsoft Visual C# 2005, .NET Framework 3.5, .NET Framework 3.0, .NET Framework 2.0
Product Class: User Interface Components
Search Items: New Product Feb 03
Keywords: Mining analyze analyse analysis データ分析 On-Line Analytical OLAP analysis analyze analyse Grid Grids Table Tables DataGrid DataGrids Developer Express devexpress Enterprise Partner ASP xPivotGrid ASPx PivotGrid ASPxPivot Grid PivotGrid Pivot
Autor
Categoría principal
Productos relacionados
Categorias relacionadas