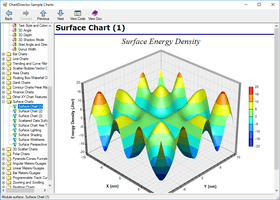
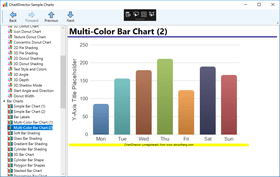
di Advanced Software Engineering - Tipo prodotto: Componente / .NET Class / Managed/Unmanaged Code - without COM / ActiveX DLL / VC++ Class Library / Java Applet / Java Servlet / JavaBean / Java Class
Ti preghiamo di notare che le informazioni su questi prodotti non sono disponibili in italiano.
Create charts in PNG, JPEG, BMP, WBMP and GIF, viewable by virtually all browsers, including mobile and hand-held devices. ChartDirector is a professional chart component for windows and web applications. ChartDirector produces charts that are small in file size. A typical 200 x 200 pixels chart is only 500 - 2000 bytes. Charts can be embedded in email, word documents, PDF, etc. as images. No client side Java or ActiveX controls required. AJAX enabled for web applications so charts can be updated without page refresh. Multi-Platform: ChartDirector API is available in ASP/COM/VB, .NET, Java, PHP, Perl, Python and C++. ChartDirector for ASP/COM/VB and .NET runs on Windows. ChartDirector for PHP, Perl, Python, Ruby and C++ run on Windows, Linux (i386, x86_64), FreeBSD (i386) or Solaris (Sparc). Perl 5.6.0 or above on Mac OS X (PowerPC, Intel).
Recensione media:
basata su: 2 recensioni.
I nostri prezzi standard sono indicati sotto. Accedi per vedere i tuoi prezzi scontati.
| Aggiungi al carrello | $ 146.02 | 1 Developer License from 1 to 4 Developers - per Developer - Includes one year free upgrades. | Download (163.6 MB) | |
| Aggiungi al carrello | $ 116.62 | 1 Developer License from 5 to 19 Developers - per Developer - Includes one year free upgrades. | Download (163.6 MB) | |
| Aggiungi al carrello | $ 87.22 | 1 Developer License for 20 Developers and over - per Developer - Includes one year free upgrades. | Download (163.6 MB) | |
| Aggiungi al carrello | $ 734.02 | 1 Redistribute License (Developer License Required) - Includes one year free upgrades. | Download (163.6 MB) |
| Aggiungi al carrello | $ 97.02 | 1 Developer License from 1 to 4 Developers - per Developer - Includes one year free upgrades | Download (163.6 MB) | |
| Aggiungi al carrello | $ 77.42 | 1 Developer License from 5 to 19 Developers - per Developer - Includes one year free upgrades | Download (163.6 MB) | |
| Aggiungi al carrello | $ 57.82 | 1 Developer License for 20 Developers and over - per Developer - Includes one year free upgrades | Download (163.6 MB) | |
| Aggiungi al carrello | $ 489.02 | 1 Redistribute License (Developer License Required) - Includes one year free upgrades | Download (163.6 MB) |
I nostri prezzi comprendono l'assistenza tecnica ComponentSource e, per la maggior parte dei prodotti scaricabili, una copia di riserva online e un aggiornamento GRATUITO alla nuova versione, se questa viene lanciata entro 30 giorni dall'acquisto. Tutte le vendite sono soggette ai nostri termini e condizioni standard ed alla nostra politica di rimborso. Contattaci se necessiti di un'opzione di licenza non elencata sopra, comprese licenze multiple e versioni precedenti.
I nostri prezzi standard sono indicati sopra. Accedi per vedere i tuoi prezzi scontati.
General Features
Layering Architecture
Enables you to synthesize the charts you want using standard chart layers. Use layers to create arbitrary combo charts, add special symbols, marks and labels to charts, highlight chart objects, add error bands ...
Comprehensive Chart Styles
Pie, donut, bar, line, spline, step line, trend line, curve-fitting, inter-line filling, area, band, scatter, bubble, floating box, box-whisker, waterfall, finance, gantt, vector, radar, polar, rose ...
Financial Library with Source Code
Includes sophisticated financial charting library with 46 technical indicators. Comes with source code.
Angular meters of arbitrary angular span. Linear meters in horizontal and vertical orientations.
Unparalleled Customizability
Powerful object oriented API allows you to customize every chart details.
Flexible Axis System
Unlimited number of XY axes per chart. Automatic, semi-automatic and manual scaling. Linear, log, date/time and label-based axis. Configurable axis margins. Customizable axis labels.
Markup Text Support
The innovative ChartDirector Markup Language (CDML) technology allows rich formatting of text - embed icons and images in text, use multiple fonts and colors in the same piece of text, control text layout, alignment, line-spacing, wrapping, truncation, ...
Advanced Color System
All objects in ChartDirector are painted using configurable "color brushes", supporting ARGB colors (true color with alpha transparency), pattern colors (wallpaper), gradients, metallic colors, and threshold colors (colors that depend on data values).
AJAX Enabled User Interactions
Full suite of mouse events for chart objects. Customizable hot spots on charts. Pop-up tool tips, drill-down, drag to zoom and drag to scroll support. AJAX enabled for web applications so charts can be updated without page refresh.
Browser Compatibility
Produces charts in PNG, JPEG, BMP, WBMP and GIF. Viewable by virtually all browsers, including mobile and hand-held devices. Charts can be embedded in email, word documents, PDF, etc. as images. No client side Java or ActiveX controls required.
On the Fly Chart Creation and Delivery
Charts can be generated and delivered to the browser on the fly as standard HTTP image data. No temporary image files needed.
Bandwidth Efficient
Optimized color reduction algorithm for creating palette based charts that look as good as true color charts, but with much smaller file size. Ideal for Internet applications.
Easy to Use
Producing charts requires just a few lines of code. Comprehensive documentation and numerous sample programs.
Internationalization
Unicode characters support. Configurable number and date/time formats.
64 Bit Compatible
Works now on 64bit OS like Vista 64-bit
ASP/COM/VB Specific Features
.NET Specific Features
JSP/Java Specific Features
PHP Specific Features
Perl Specific Features
Python Specific Features
Ruby Specific Features
C++ Specific Features