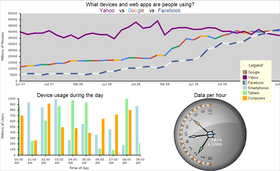
MindFusion.Charting for WinForms
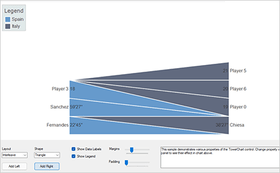
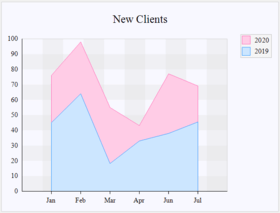
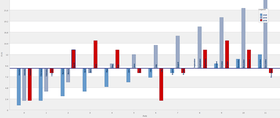
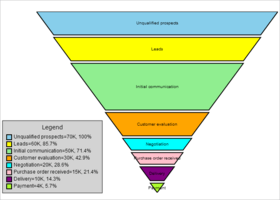
A smart dashboard control, which provides a rich set of highly customizable charts and gauges.
Published by MindFusion Group
Distributed by ComponentSource since 2003
Prices from: $ 294.00 Version: 4.2 Updated: Jan 4, 2022