
XtraPivotGrid Suite
Fast, fully customizable OLAP grid.
Pubblicato da DevExpress
Distribuito da ComponentSource dal 2001
Fast, fully customizable OLAP grid.
Pubblicato da DevExpress
Distribuito da ComponentSource dal 2001

New licenses can only be purchased as part of DevExpress DXperience, DevExpress Universal or DevExpress WinForms
If you require information, please visit the pages above or Contact Us for pricing and availability.
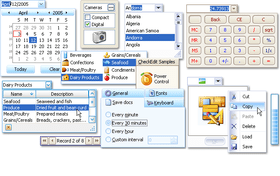
XtraPivotGrid is an Excel-like pivot table engineered for multi-dimensional data analysis and cross-tab report generation. Numerous layout customization options give you total control over its UI and user-centric features make it easy to deploy. The Xtra Pivot Grid Suite was engineered from the ground-up to eliminate the limitations imposed by out-of-process solutions and to radically improve the way in which data-centric applications deliver information to end-users. With its powerful data architecture, the Xtra Pivot Grid is able to slice and dice information efficiently and intuitively present it to end-users. It delivers numerous layout customization options with total end-user control over each individual on-screen report.


Immagine 1/6
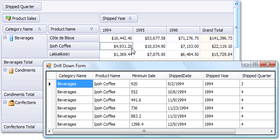
Actionable On-Screen Analytics
The DevExpress WinForms Pivot Grid Control has the power to convert hard to read and difficult to dissect dataset information into compact and summarized visual reports so your application can efficiently address real-time business analysis needs. The fully customizable design of the Pivot Grid ensures that end-users can modify any layout visually in order to examine data from different/multiple perspectives.
OLAP Support and Asynchronous Data Processing
Microsoft...

XtraPivotGrid Suite è disponibile anche in:
Chatta live con i nostri specialisti di gestione delle licenze di DevExpress ora.


Tel: (888) 850 9911
Fax: +1 770 250 6199


