


Fornecedor oficial
Como distribuidores oficiais e autorizados, nós fornecemos licenças legítimas diretamente de mais de 200 editores de software.
Ver todas as nossas marcas.
Continuar leitura em inglês:
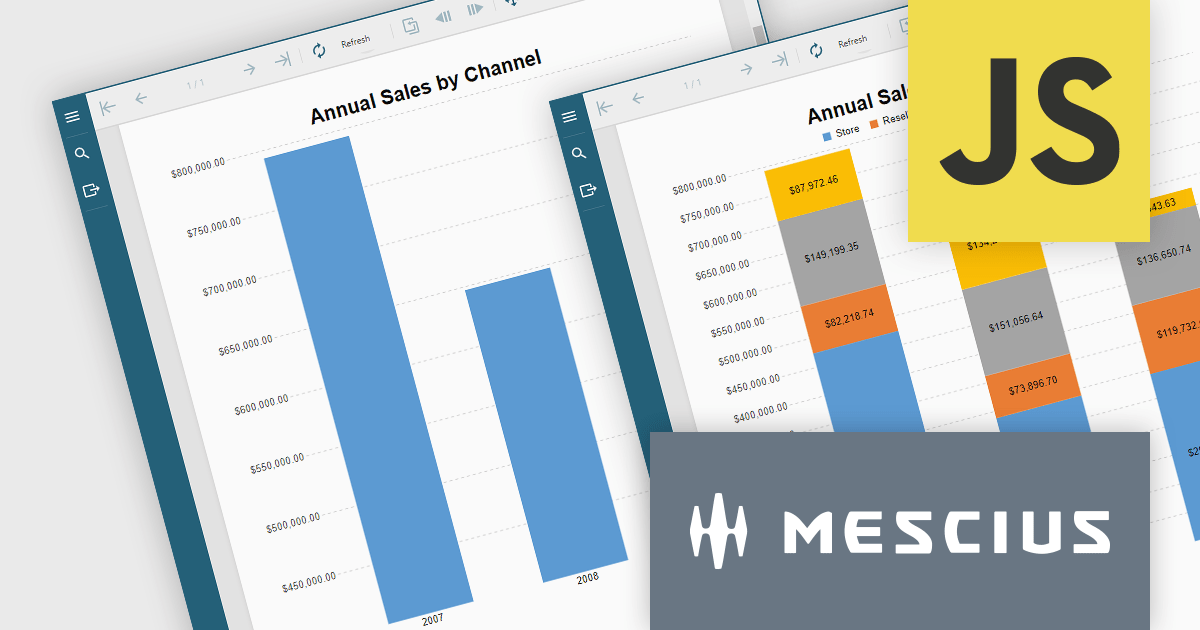
ActiveReportsJS is a reporting tool for web applications that allows developers and report authors to easily design and display reports within their applications. With a wide range of features, such as drill-down, runtime data filtering, and parameter-driven reports, as well as compatibility with popular frameworks, ActiveReportsJS simplifies the process of creating and managing reports.
In this blog post, MESCIUS Technical Engagement Engineer Joel Parks shows you how to utilize ActiveReportsJS to incoporate charts into your JavaScript report, and bind your chart data together through the use of parameterized drill-through navigation, allowing your users to easily traverse between them. Steps include:
Read the complete blog now, and start adding drill-through chart functionality to your JavaScript report using ActiveReportsJS.
ActiveReportsJS is licensed on an annual subscription or perpetual basis and is available as a Single Deployment License for non-commercial use, and as a Single Domain License or Unlimited Domain License for commercial and/or SaaS use. See our ActiveReportsJS licensing page for full details.
For more information, visit our ActiveReportsJS product page.
Tel: (888) 850 9911
Fax: +1 770 250 6199


