官方供应商
我们作为官方授权经销商,直接提供超过200家开发厂家所发行超过1000个的产品授权给您。
查看我们的所有品牌。

截图: Connect many kinds of data sources to the xamChart to graph data points on any number of data ... 阅读更多 显示有关该产品的更多结果
截图: xamChart brings your WPF application both common chart types (incl. pie charts, line charts, bar ... charts and more) as well as chart types for specialized applications, like financial candle charts. ... 阅读更多
截图: Most chart elements derive from the common base class, FrameworkContentElement, giving you its ... Style extensibility point so you can customize aspects of chart elements ranging from foreground color ... 阅读更多

截图: Radar Series, used to create a Radar Chart (Spider Chart, Star Chart), is rendered to a circular ... graph and is used primarily as a multi-parameter data comparison tool. ... 阅读更多 显示有关该产品的更多结果
截图: Clustering and stacking may be combined into the same chart. In a 3D scene, clustered and stacked ... 阅读更多
截图: A pie chart may be rendered in different shapes- standard and smooth edge pie, standard, smooth ... edge or cut edge ring and torus, thus increasing the diversity of chart looks available ... 阅读更多

截图: to automatically display graphs or flow charts following aesthetic rules. ... 阅读更多 显示有关该产品的更多结果
截图: that performs a symmetric layout on a grap, TFlow that allows performing a tree layout on a graph and OFlow ... to perform an orthogonal layout on a graph. ... 阅读更多
截图: node a random or a (0,0) position. Then you call the layout method of the graph layout control of your ... 阅读更多

截图: Charts are optimized to handle thousands of data points seamlessly, with the ability to zoom ... 阅读更多 显示有关该产品的更多结果
截图: 0 ... 阅读更多
截图: Build visually-pleasing dashboards with highly customizable charts and gauges. ... 阅读更多

截图: Radar Area Chart 阅读更多 显示有关该产品的更多结果
截图: 3D Bubble Chart 阅读更多
截图: Preview Charts 阅读更多

截图: Radar Area Chart 阅读更多 显示有关该产品的更多结果
截图: 3D Bubble Chart 阅读更多
截图: Radial Layout 阅读更多

截图: ComponentOne Chart for WPF, included in ComponentOne Studio for WPF, offers advanced features like ... OnLoad Animation for 3D Charts. ComponentOne Chart for WPF 2009 has new chart types: Radar, ... 阅读更多 显示有关该产品的更多结果
截图: ComponentOne PDF for WinForms 2009 PDF now supports AcroForms/AcroFields support. You can create Acrobat forms with the following filed types: textbox, checkbox, radio button, push button, combo box, and list box ... 阅读更多
截图: ComponentOne Studio for ASP.NET 2009 Release adds more interaction on the client-side with new lightweight, high-performance controls: GridView, ToolBar, Editor, Schedule, Calendar, and Input. ComponentOne Schedule for ASP.NET has the same object model as the classic ComponentOne WebSchedule for ... 阅读更多

截图: Screenshot of Nevron.NET Vision Ultimate 阅读更多 显示有关该产品的更多结果
截图: Screenshot of Nevron.NET Vision Ultimate 阅读更多
截图: Screenshot of Nevron.NET Vision Ultimate 阅读更多

截图: The new Component designer that shows how easily to set pivot charting properties. ... 阅读更多 显示有关该产品的更多结果
截图: The pivot charting feature in WebGrid Enterprise 8 is now rendered flawlessly across all browsers, ... 阅读更多
截图: Intersoft UXChart is a collection of feature-packed advanced charting control for your Silverlight ... 阅读更多

截图: Display data in many different forms of chart.. ... 阅读更多 显示有关该产品的更多结果
截图: Set alarm trigers on your charts. ... 阅读更多
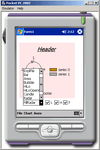
截图: Display a chart of the Pocket PC's memmory load. ... 阅读更多