Data visualization components implement the functionality to view data in tables or data grids, as simple charts or complex graphs and enables you to create sophisticated management dashboards using gauges, maps and flowcharts.
Advanced data visualization for more informative reports.
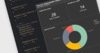
Nevron Gauge for SSRS - Delivers a complete set of gauge types, highly customizable axes, tight data integration and unmatched visual effects to your reports. It includes linear gauges, state indicators and numeric displays.
Add interactive charts and maps to your apps and websites.
Map collection - Highcharts Maps includes a collection of maps, optimized for use with Highcharts Maps. For common maps, it saves you the trouble of finding or drawing suitable SVG or GeoJSON maps. Instead, you can choose between hundreds of pre-generated maps of countries, regions and other administration levels.
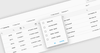
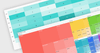
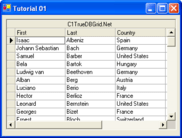
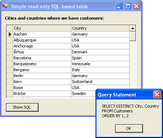
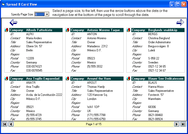
JavaScript data grid that looks and feels like a spreadsheet.
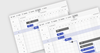
Filtering - You can filter data using a range of predefined conditions. The hidden rows are not rendered at all, which is good for overall table performance. The component is designed to handle hundreds of thousands of cells without delays or slowdowns.
Adaptive UI for building Windows 10 apps with one code base.
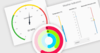
UWP Gauge - The UWP Gauge control helps you build business dashboards or craft graphical indicators. It includes a rich assortment of circular, linear and numeric gauge types and offers powerful customization.
Data visualization components for desktop and Web applications.
Nevron Gauge and Map for .NET - Suitable for any application that needs to visualize KPIs, scorecards or geographical data. The controls feature a full set of radial and linear gauges, LED displays, state indicators, and map projections.
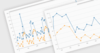
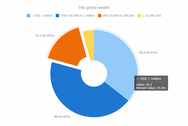
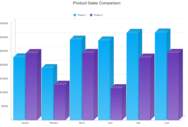
Create interactive JavaScript charts for Web, Mobile & Enterprise applications.
Chart Flexibility - FusionCharts gives you complete flexibility to customize the charts. You can centrally control the cosmetics of your charts like background color, plot colors, fonts etc. with the advanced theming engine.
A 100% JavaScript flowcharting/diagramming component.
Customization - Distinct shapes, styles, colors and fonts can be defined on a per item basis, or as default properties for the whole diagram. You can also control how the user interacts with the diagram, for example, preventing them from creating new links.
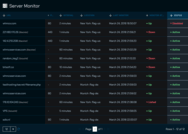
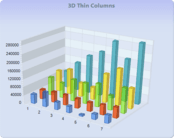
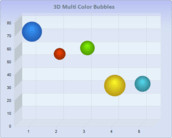
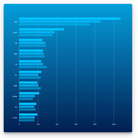
Create animated and interactive charts with thousands of data records.
Chart Types - Choose from over 35 built-in chart types and modules including: area, bar, 100% stacked, boxplot, bubble, bullet, gauge, heatmap, pie radar and more. You can also easily add additional charts to the same page.
Interactive Charts & Graphs - Visualize and analyze data with 30+ charts and graphs ranging from line to financial charts. Users can interact and explore with features such as zoom and pan, selection, tooltip and trackball.