Data visualization components implement the functionality to view data in tables or data grids, as simple charts or complex graphs and enables you to create sophisticated management dashboards using gauges, maps and flowcharts.
Advanced data visualization for more informative reports.
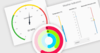
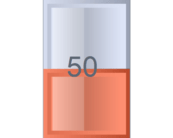
Nevron Gauge for SSRS - Delivers a complete set of gauge types, highly customizable axes, tight data integration and unmatched visual effects to your reports. It includes linear gauges, state indicators and numeric displays.
Add interactive charts and maps to your apps and websites.
Responsive Stock Charts - Highcharts Stock's responsiveness goes beyond simply fitting the chart to the dimensions of its container. It also automatically finds an optimal placement for non-graph elements such as legends and headings.
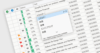
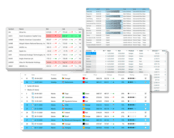
JavaScript data grid that looks and feels like a spreadsheet.
Data Grid Features - Handsontable easily integrates with any data source and comes with lots of useful features including data binding, validation, sorting and a powerful context menu. It is available for pure JavaScript and also includes wrappers for React, Vue.js and Angular.
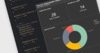
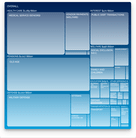
Adaptive UI for building Windows 10 apps with one code base.
UWP ListView - The UWP ListView control offers two built-in layout types. Stack arranges items in a vertical / horizontal scrolling list. Wrap arranges items in a wrapped grid.
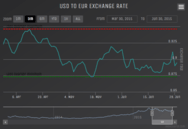
Create stock or general timeline charts for your Web and mobile apps.
Stock and Timeline Charts - Highcharts Stock provides a wide range of dynamic, responsive stock chart types and timelines which can be used to visualize the most complex data in an understandable, user-friendly format.
A comprehensive JavaScript charting library, with 40+ chart types.
Interactive Zooming/Scrolling - Display tens of thousands of data points like stock quote comparison for a decade with a neatly-compressed macroscopic view. The user can easily and intuitively zoom into any subset of data.
A pure JavaScript library that makes it easy to create responsive and interactive charts.
Debugger - The Highcharts Debugger helps you speed up development by providing instantaneous warnings and error reports for your charts. The error messages provide clear instructions on how to resolve your issue.
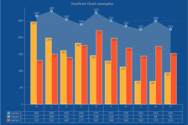
Create animated and interactive charts with thousands of data records.
Performance - ZingChart offers canvas and SVG rendering options depending on your speed needs. You can render 100,000 data points in under a second and because the entire chart is a JSON object the state of the chart is 100% savable across platforms.
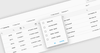
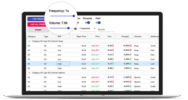
Build responsive, interactive JavaScript data grids and tables.
Conditional Formatting - Easily customize the look and feel of your grids and tables using conditional formatting to render content differently based on a value. You can perform row, column or cell formatting.
.
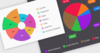
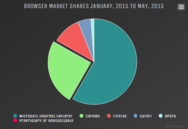
Pie charts allow users to easily see the relative sizes of different categories in a data set, offering a clear overview of a whole and its component parts.