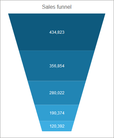
Data visualization components implement the functionality to view data in tables or data grids, as simple charts or complex graphs and enables you to create sophisticated management dashboards using gauges, maps and flowcharts.
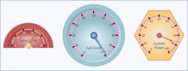
Advanced data visualization for more informative reports.
Nevron Gauge for SSRS - Delivers a complete set of gauge types, highly customizable axes, tight data integration and unmatched visual effects to your reports. It includes linear gauges, state indicators and numeric displays.
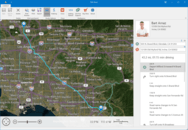
Add interactive charts and maps to your apps and websites.
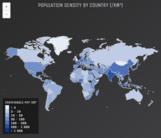
Map collection - Highcharts Maps includes a collection of maps, optimized for use with Highcharts Maps. For common maps, it saves you the trouble of finding or drawing suitable SVG or GeoJSON maps. Instead, you can choose between hundreds of pre-generated maps of countries, regions and other administration levels.
JavaScript data grid that looks and feels like a spreadsheet.
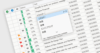
Data Grid Features - Handsontable easily integrates with any data source and comes with lots of useful features including data binding, validation, sorting and a powerful context menu. It is available for pure JavaScript and also includes wrappers for React, Vue.js and Angular.
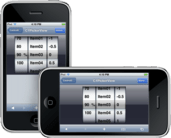
Award-winning .NET and JavaScript controls for mobile, Web and desktop.
Powerful Data Visualization - Whether you need 80+ charts, Gantt views, pivot tables, gauges, maps, or sparklines, ComponentOne Studio’s data visualization controls handle large data sets and impress your users with professional design.
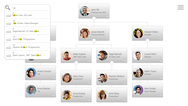
Diagramming components for dependency visualization and analysis.
Stable Auto Layout - To prevent multi-parent hierarchy diagrams changing dramatically each time a node is added/removed, rules can be set for ordering nodes relative to each other. Because they are soft rules it does not enforce the layout so the control can still choose the optimal layout.
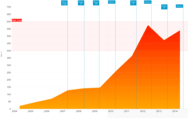
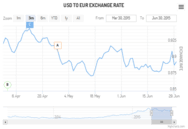
A pure JavaScript library that makes it easy to create responsive and interactive charts.
Dynamic and Customizable - The elegant charts render crisp and clear at any resolution and are easily styled using JavaScript or CSS. Highcharts is also extendable and pluggable for experts seeking advanced animations and functionality.
Connectivity and Exporting - TeeChart JS allows you to easily connect your charts to an existing database or dataset using JSON or XML. Charts can also be exported to PNG or JPEG images as required.
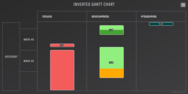
Create highly customized and unique data visualizations.
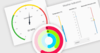
Corona Chart - This radial chart provides angular and curved radial area line curves and supports both an overlap and stacked layout. It also features over a dozen different dynamic styles and comes bundled with an easy to use test container that demonstrates seven uniquely styled themes.
High-performance JavaScript UI controls for Enterprise apps.
Lightning-fast Data Grid - FlexGrid includes flexible data binding, multi-format export and import, data presentation formatting, and exhaustive samples and customization. Excel-like keyboard support, data aggregation, cell merging, star sizing and cell freezing all create an Excel-like experience.
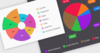
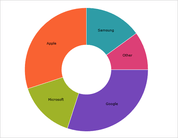
Pie charts allow users to easily see the relative sizes of different categories in a data set, offering a clear overview of a whole and its component parts.