Geo-Heatmaps mit Interpolation verbessern
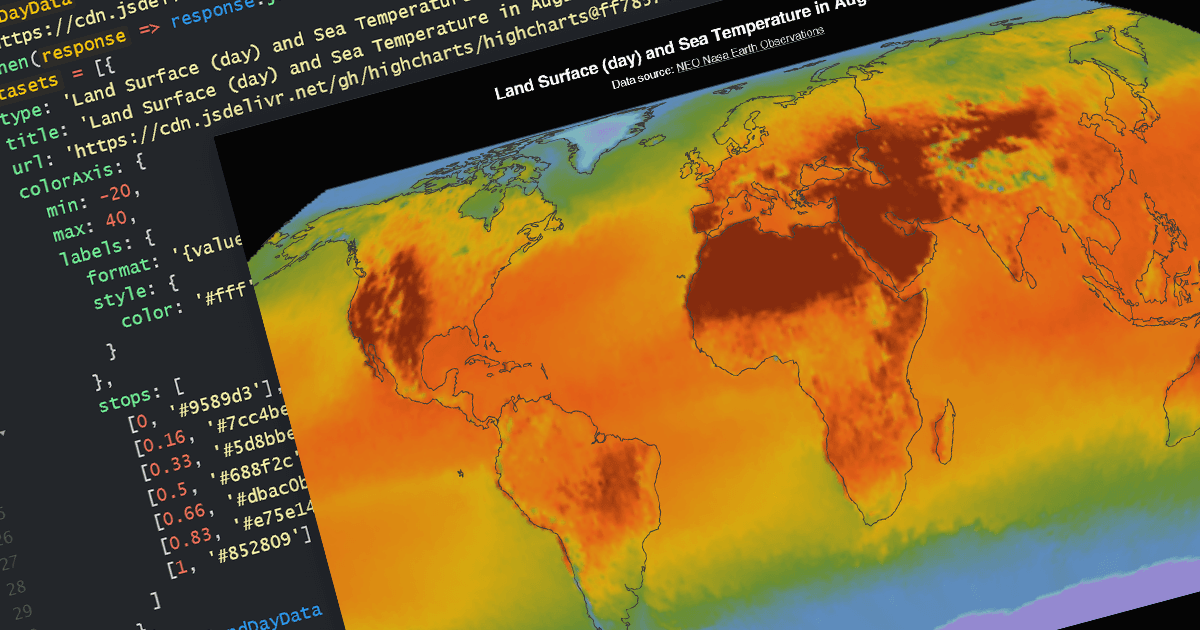
Highcharts Maps v11.2.0 bietet Unterstützung für die Interpolation geografischer Heatmaps und ermöglicht es Ihnen, geschätzte Werte zwischen bekannten Datenpunkten für Diagramme im Stil von Temperaturkarten hinzuzufügen.
Highcharts Maps bietet eine standardskonforme Methode zur Erstellung schematischer Karten in webbasierten Projekten. Es erweitert die benutzerfreundliche Highcharts-JavaScript-API, sodass Webentwickler interaktive Karten erstellen können, die Verkäufe, Wahlergebnisse oder jede andere geografisch relevante Information anzeigen.
Mit dem Release von Highchartts Maps v11.2.0 wird die Unterstützung für Interpolation in geografischen Heatmaps hinzugefügt. Die Funktion geoheatmap.interpolation ermöglicht es, dass die Heatmap ihre Datenpunkte als interpoliertes Bild darstellt und Werte zwischen bekannten Datenpunkten schätzt. Beispielsweise können Sie eine Tabelle mit Temperaturdaten haben, die die Temperatur an bestimmten Punkten innerhalb einer Region zeigt. Sie können die Interpolation verwenden, um die Temperatur in Bereichen zwischen den bekannten Datenpunkten zu schätzen. Diese neue Funktion hilft dabei, einfacher verständliche und optisch ansprechende Heatmaps zu erstellen, selbst mit begrenzten Datensätzen.
Um eine vollständige Liste der Neuerungen in Version 11.2.0 zu sehen, lesen Sie unsere Release-Notes.
Weitere Informationen finden Sie auf unserer Highcharts-Maps-Produktseite.