Fügen Sie Candlestick-Diagramme zu Ihren WinForms-Apps hinzu
Kandlestick-Diagramme bilden die Kursentwicklung, den Open/Close sowie die Hochs/Tiefs visuell ab und zeigen Marktstimmung sowie Trading-Möglichkeiten auf.
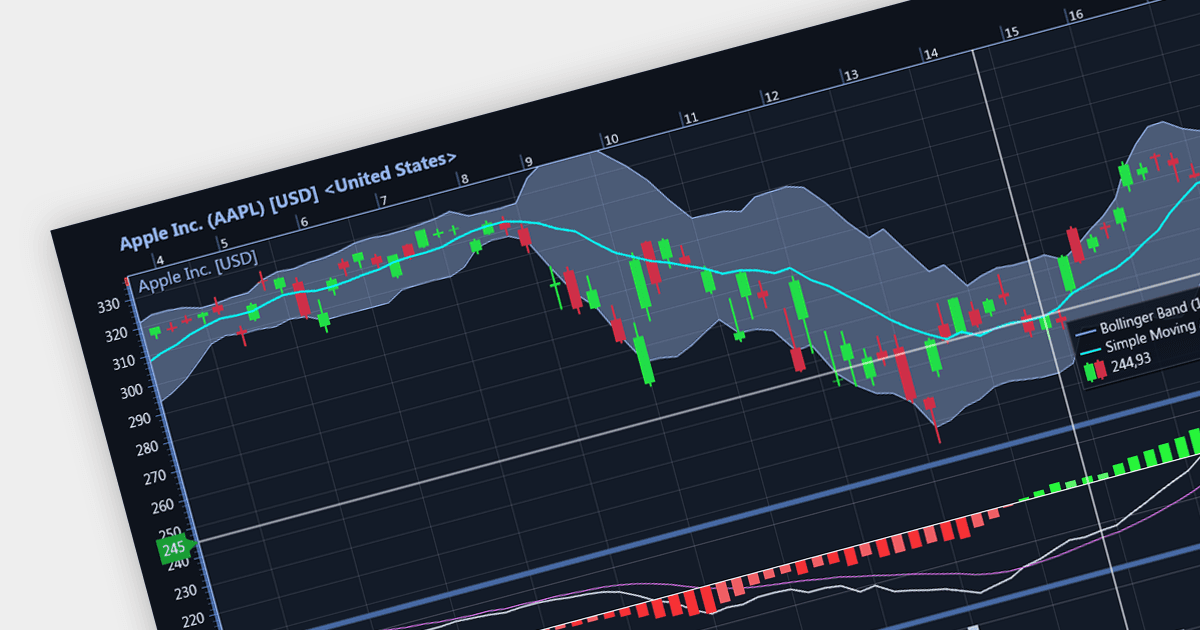
Kandlestick-Diagramme sind eine Art von Finanzchart, die zur Beschreibung von Kursbewegungen eines Wertpapiers, Derivats oder einer Währung verwendet wird. Jede „Kerze“ zeigt typischerweise einen Tag an: Die zentrale „Box“ stellt den Bereich zwischen den Eröffnungs- und Schlusskursen dar, und die Linien zeigen die Hochs und Tiefs. Das einzigartige visuelle Format hilft Tradern, die Marktstimmung schnell zu verstehen.
Mehrere WinForms-Chart-Steuerelemente bieten Candlestick-Diagramme, darunter:
- DevExpress WinForms Chart (Teil von DevExpress WinForms) bietet präzise Kontrolle über jeden Aspekt der Candlesticks – von Schattierungen bis zu Wicks – und eignet sich ideal für die technische Analyse.
- ComponentOne Charts for WinForms (Teil von ComponentOne Studio WinForms) enthält integrierte Candlestick-Vorlagen und Finanzindikatoren, die die Marktanalyse beschleunigen.
- Telerik Windows Forms ChartView (Teil von Telerik UI for WinForms) bietet ein optimiertes Candlestick-Rendering mit nahtlosem Zoomen/Schwenken und eignet sich ideal für dynamische Trading-Plattformen.
- Syncfusion WinForms Chart (Teil von Syncfusion Essential Studio Enterprise) bietet umfangreiche Anpassungsoptionen, mit denen Sie Candlesticks genau an Ihre Trading-Anforderungen anpassen können.
- LightningChart .NET bietet schnelle Candlestick-Updates, die Sie dem Markt voraus halten – perfekt für Echtzeit-Trading-Dashboards.
Für eine eingehende Analyse von Funktionen und Kursen besuchen Sie unseren Vergleich der WinForms-Chart-Steuerelemente.