Markttrends mit visueller Präzision veranschaulichen
JavaScript-Chart-Controls mit Kagi-Diagrammen reduzieren Störrauschen, heben Ausbrüche hervor und machen Angebots- und Nachfragetendenzen in Marktdynamiken sichtbar.
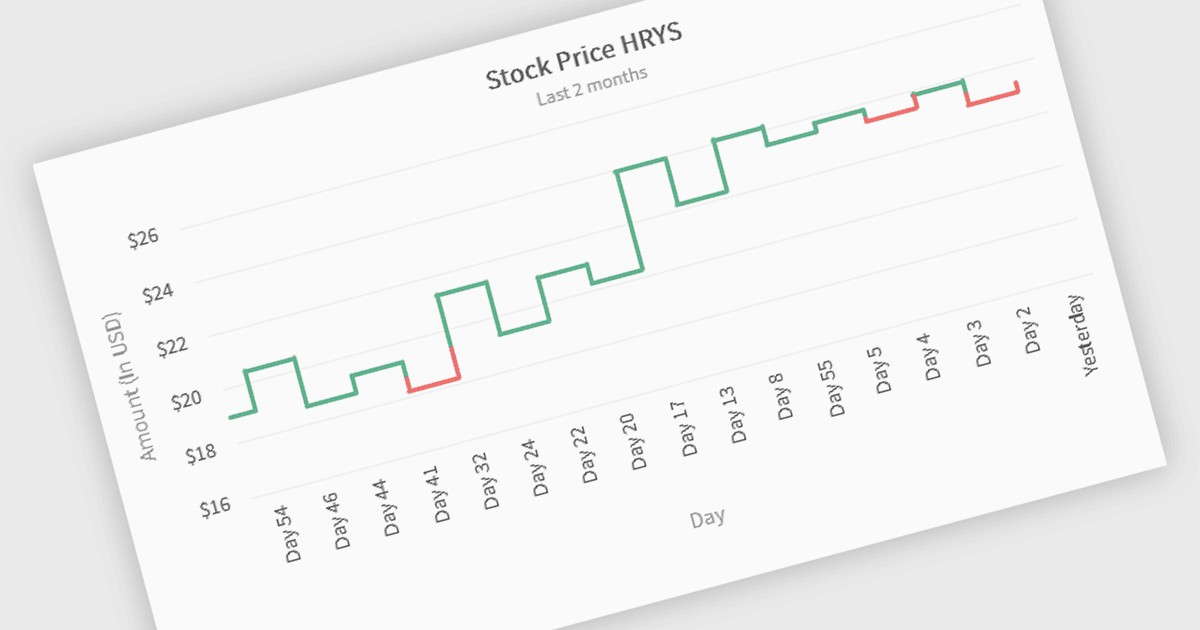
Kagi-Diagramme sind ein Tool der technischen Analyse, das Kursbewegungen durch vertikale Linien darstellt und dabei die Zeit ausblendet, um sich auf bedeutende Kursveränderungen zu konzentrieren. Dikke Linien zeigen steigende Nachfrage an, wenn Kurse über vorherige Hochs ausbrechen, während dünne Linien eine erhöhte Angebotsmenge signalisieren, wenn Kurse unter vorherige Tiefs fallen. Dieses klare visuelle Format hilft Tradern, Störrauschen herauszufiltern, Trends zu erkennen und wichtige Ausbrüche oder Umkehrpunkte zu identifizieren. Ideal zur Analyse der Marktstimmung werden Kagi-Diagramme in Aktien, Forex und Rohstoffen eingesetzt, um fundierte, datenbasierte Handelsentscheidungen zu unterstützen.
Mehrere JavaScript-Chart-Komponenten bieten Kagi-Diagramme, darunter:
- Wijmo FlexChart (Teil von Wijmo by MESCIUS) ermöglicht es Ihnen, Preisdynamiken mit Kagi-Diagrammen zu interpretieren, Störrauschen herauszufiltern, um klarere Handelssignale und Stimmungsbilder zu offenbaren.
- FusionCharts Suite XT ermöglicht die Darstellung von Kagi-Diagrammen, um Kursausbrüche und Umkehrpunkte hervorzuheben und die Klarheit in trendbasierten Marktvisualisierungen zu verbessern.
- LightningChart JS Trader ermöglicht es Ihnen, Verschiebungen von Angebot und Nachfrage mit Kagi-Diagrammen zu visualisieren, um eine Analyse von Finanzdaten in hoher Leistung und Echtzeit zu unterstützen.
Für eine eingehende Analyse der Funktionen und Preise besuchen Sie unseren Vergleich der JavaScript-Charts.