Änderungen verfolgen, während sie passieren – mit Live-Diagrammen
Live-Chart-Daten anzeigen, um Echtzeit-Insights zu liefern, schnellere Entscheidungen zu ermöglichen, Probleme früher zu erkennen und noch ansprechendere, präzisere Berichte bereitzustellen.
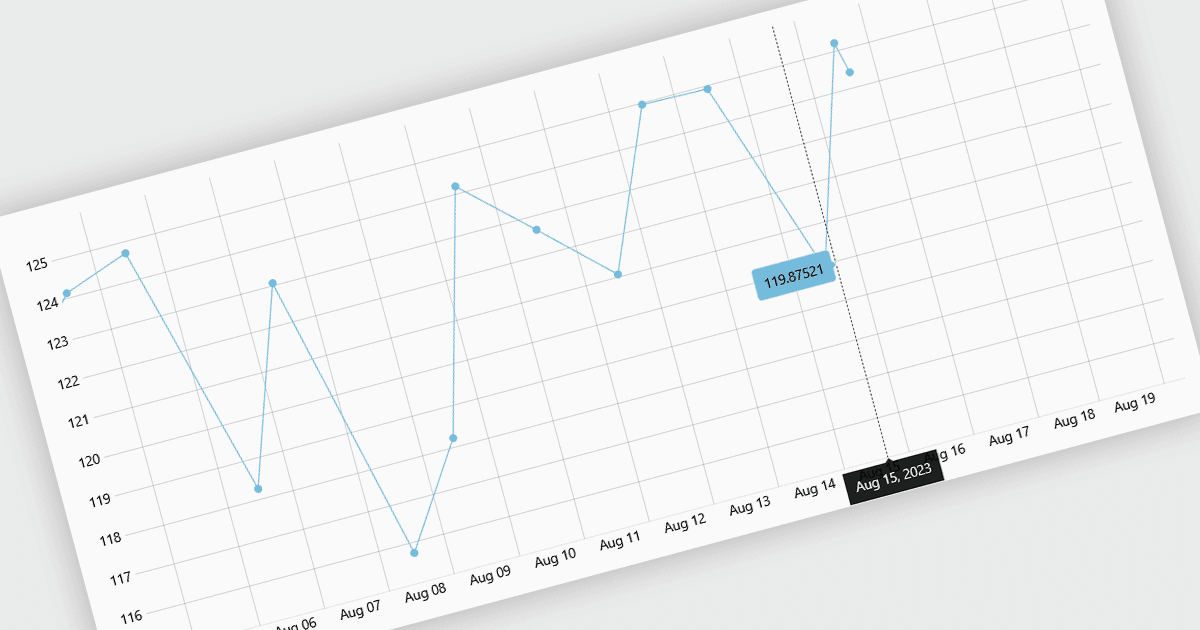
Live-Datenunterstützung für Diagramme ermöglicht Visualisierungen, die sich automatisch aktualisieren, sobald neue Informationen eintreffen. So werden statische Dashboards zu fortlaufend aktualisierten, Echtzeit-Ansichten. Das reduziert die Abhängigkeit von manuellen Aktualisierungen oder geplanten Berichten und hilft dabei, Entscheidungen auf Basis veralteter Daten zu vermeiden. Teams erhalten sofortige Einblicke in sich verändernde Bedingungen, erkennen Anomalien, Leistungsprobleme oder Chancen, sobald sie auftreten. Typische Anwendungsfälle sind die Überwachung des Website-Traffics, der Anwendungsleistung, der Finanzmärkte, von IoT-Sensoren und von Business-KPIs wie Bestellungen, Umsatz oder Support-Queues. Durch das sofortige Sichtbarmachen aktueller Kennzahlen verbessern Live-Diagramme Reaktionsfähigkeit, operative Kontrolle sowie Vertrauen in datenbasierte Entscheidungen und Ergebnisse in der gesamten Organisation.
Mehrere React-Diagramm-Controls unterstützen Live-Daten, darunter:
- DevExtreme React Chart (Teil von DevExtreme Complete by DevExpress) ermöglicht es, Live-Daten in interaktive Visualisierungen zu streamen und Dashboards kontinuierlich aktuell zu halten.
- amCharts 5: Charts erlaubt es, sich ständig aktualisierende Live-Daten zu visualisieren und Änderungen nahtlos zu animieren, damit Nutzer sofort sich entwickelnde Trends und Anomalien erkennen.
- Ignite UI for React Chart (Teil von Infragistics Ignite UI by Infragistics) ermöglicht das Rendern von hochfrequenten Echtzeit-Datenstreams und sorgt so für responsive, leistungsstarke Dashboards.
- FusionCharts Suite XT erleichtert Echtzeit-, selbstaktualisierende Diagramme, die Live-Daten von Servern abrufen und so Monitoring-Dashboards, Trading-Interfaces und operative Ansichten antreiben.
Für eine ausführliche Analyse der Funktionen und des Preises besuchen Sie unseren Vergleich der React-Diagramm-Controls.