Aktien- bzw. Kursdaten mit OHLC-Diagrammen in .NET anzeigen
Erweitern Sie Finanz-Apps mit leistungsstarker Datenvisualisierung, indem Sie OHLC- (Open-High-Low-Close-) Diagramme nutzen, um Kursbewegungen über die Zeit anzuzeigen.
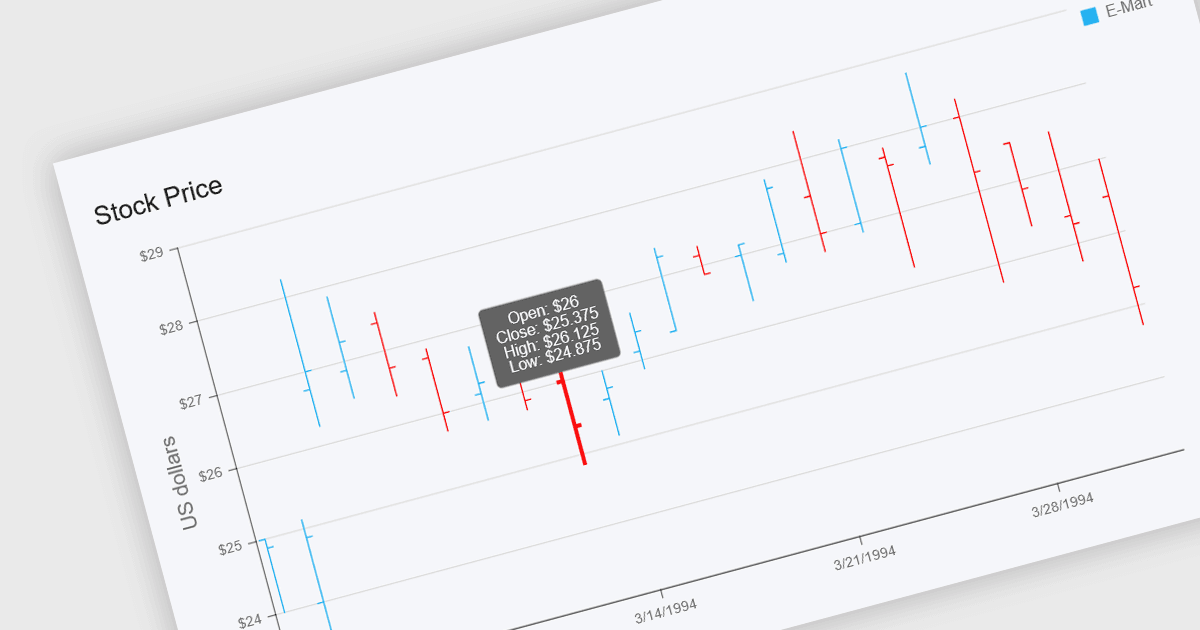
OHLC-Diagramme, abgekürzt für Open-High-Low-Close-Diagramme, sind eine Art Finanzdiagramm, das verwendet wird, um Kursbewegungen von Assets über einen bestimmten Zeitraum darzustellen. Jeder Punkt im Diagramm fasst die Eröffnungs-, die höchste, die niedrigste und die Schlussposition eines einzelnen Zeitabschnitts zusammen, typischerweise dargestellt mit vertikalen Balken mit Markierungen, die die Eröffnungs- und Schlusswerte anzeigen. Dieses Format bietet eine klare und kompakte Möglichkeit, Volatilität und Marktrends innerhalb eines festgelegten Zeitraums zu visualisieren. Für Entwickler und Analysten, die mit Finanzdaten arbeiten, sind OHLC-Diagramme besonders wertvoll, um Preis-muster zu erkennen, das Marktverhalten zu überwachen und fundierte Entscheidungen auf Basis historischer Performance zu treffen.
Mehrere .NET-Chart-Komponenten bieten OHLC-Diagramme, darunter:
- DevExpress ASP.NET Core Charts (Teil von DevExpress ASP.NET und Blazor) ermöglicht es, OHLC-Diagramme mit Tooltips und responsivem Design für eine Echtzeitanalyse zu rendern.
- ComponentOne WinForms Charts (Teil von ComponentOne Studio WinForms von MESCIUS) ermöglicht das Plotten von OHLC-Daten für eine präzise Visualisierung von Marktrends in Desktop-Apps.
- Telerik UI for WPF ChartView (Teil von Telerik UI for WPF) unterstützt das Rendern von OHLC-Diagrammen mit hoher Performance, flexiblen Achsen sowie Styling-Optionen für Desktop-Finanz-Dashboards.
- Syncfusion .NET MAUI Charts (Teil von Syncfusion Essential Studio Enterprise) ermöglicht es Entwicklern, plattformübergreifende Mobile-Apps mit interaktiven, animierten OHLC-Diagrammen zu erstellen.
Für eine eingehende Analyse von Funktionen und Preis besuchen Sie unseren Vergleich der .NET-Chart-Komponenten.