Entdecken Sie Insights mit interaktivem Diagramm-Zooming
Untersuchen Sie wichtige Datenpunkte genauer, reduzieren Sie die visuelle Komplexität und ermöglichen Sie eine präzise Trendanalyse – selbst bei den komplexesten Datensätzen.
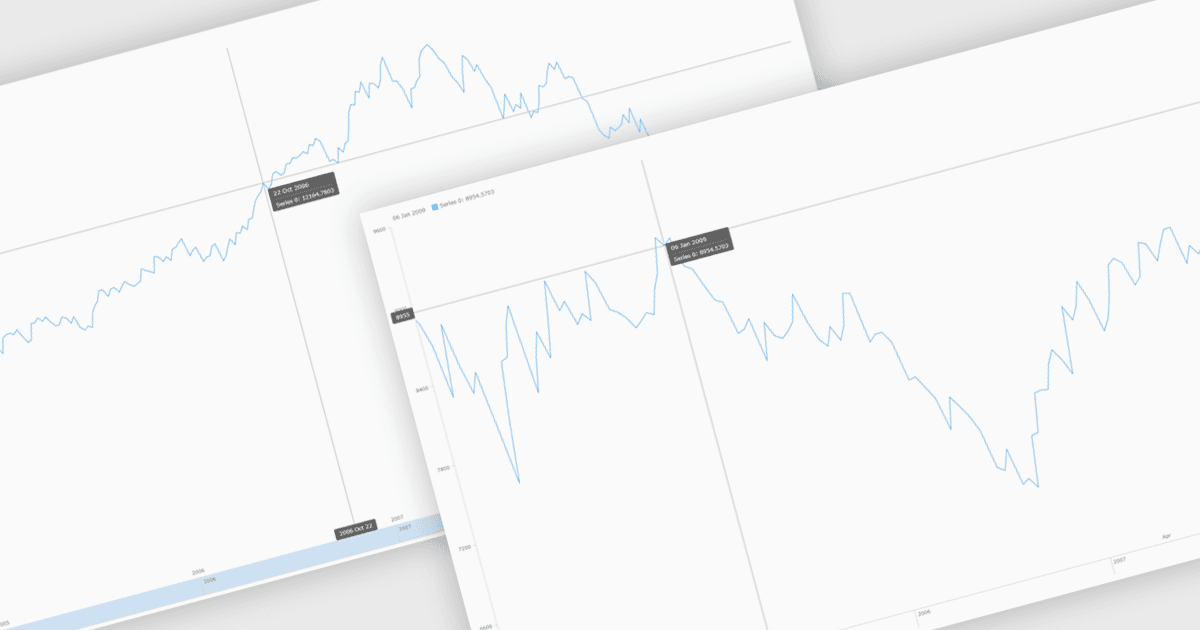
Das Zoomen von Diagrammen ermöglicht es Nutzern, den sichtbaren Bereich eines Diagramms interaktiv anzupassen, um sich auf bestimmte Datenpunkte, Zeiträume oder Wertebereiche für eine genauere Analyse zu konzentrieren. Indem Nutzern das dynamische Ein- und Auszoomen ermöglicht wird, verringert es visuelle Unübersichtlichkeit, verbessert die Verständlichkeit und hilft dabei, Trends, Anomalien oder Muster aufzudecken, die in einer Vollansicht möglicherweise schwer zu erkennen sind. Diese interaktive Funktion unterstützt schnellere, fundiertere Entscheidungen, indem sie den Wechsel zwischen einer übersichtlichen Darstellung und detaillierten Erkenntnissen erlaubt, ohne Daten neu zu laden. Häufige Anwendungsfälle sind die Analyse der finanziellen Leistung über bestimmte Zeiträume, das Untersuchen von Ausschlägen oder Rückgängen bei operativen Kennzahlen, das Durchgehen detaillierter Sensor- oder Überwachungsdaten sowie das Hervorheben wichtiger Datenabschnitte in Präsentationen oder bei Abstimmungen mit Stakeholdern.
Mehrere JavaScript-Diagramm-Controls unterstützen das Zoomen, darunter:
- Highcharts Core ermöglicht es Ihnen, Diagramme interaktiv zu zoomen, um dichte Datensätze zu erkunden, Zeitbereiche zu isolieren und Trends mit reaktionsschnellen Steuerelementen zu analysieren.
- KendoReact Charts (Teil von KendoReact von Telerik) ermöglicht ein präzises Zoomen und hilft Anwendungen dabei, klarere Erkenntnisse durch fokussierte Datenerkundung zu liefern.
- AnyChart JS erleichtert intuitives Zoomen von Diagrammen und ermöglicht es Nutzern, detaillierte Datenabschnitte zu untersuchen, während Leistung, Flexibilität und visuelle Klarheit erhalten bleiben.
- LightningChart JS ermöglicht hochwertiges Zoomen von Diagrammen für großformatige Datensätze und unterstützt die Echtzeitanalyse mit Präzision sowie mit Anforderungen an Reaktionsfähigkeit.
Für eine ausführliche Analyse der Funktionen und Preise besuchen Sie unseren Vergleich von JavaScript-Diagrammen.