Interaktive Kreisdiagramme in Vue.js-Apps erstellen
Visualisieren Sie Kategorienanteile mit responsiven Kreisdiagrammen, die Tooltips, Legenden, Beschriftungen und Animationen bieten.
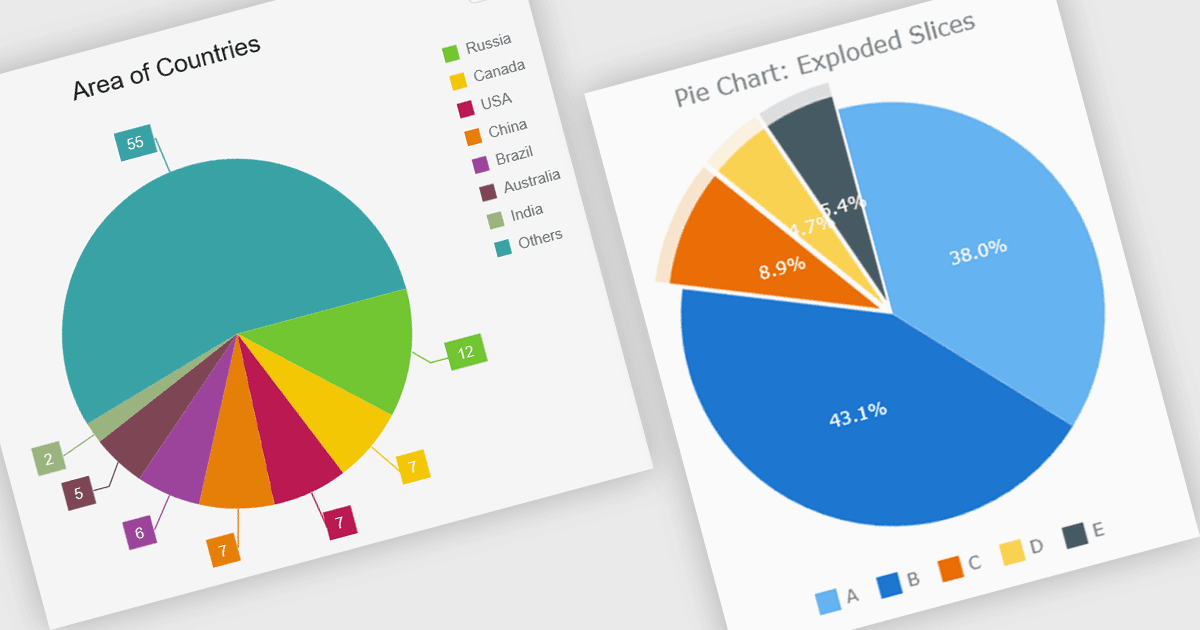
Ein Kreisdiagramm ermöglicht es Entwicklern, Daten als proportionale Segmente eines Kreises darzustellen, wobei jedes Segment den Anteil einer Kategorie an einem Gesamtergebnis repräsentiert. Es eignet sich gut für Datensätze, die Teil-zu-Ganz-Beziehungen zeigen, was es Nutzern erleichtert, relative Anteile auf einen Blick zu vergleichen. Eine gut gestaltete Implementierung enthält typischerweise interaktive Funktionen wie Tooltips, Legenden, Beschriftungen, Animationen, responsive Layouts und Anpassungsoptionen, wodurch das Diagramm nahtlos in moderne Webanwendungen integriert werden kann und eine klare sowie zugängliche Möglichkeit zur Darstellung von Kompositionsdaten bietet.
Mehrere Vue.js Chart-Komponenten unterstützen Kreisdiagramme, darunter:
- Highcharts Core ermöglicht die Erstellung interaktiver Kreisdiagramme mit umfangreicher Anpassung, responsiven Layouts, Animationen, Tooltips, Legenden und flexiblen Styling-Optionen.
- DevExtreme Vue Chart (Teil von DevExtreme Complete von DevExpress) erlaubt den Aufbau responsiver
- Kreisdiagramme mit anpassbaren Segmenten, Beschriftungen, Legenden, Animationen und interaktiven Tooltips.
- Kendo UI Vue Charts (Teil von Kendo UI von Telerik) erleichtert die Erstellung von Diagrammen mit konfigurierbaren Beschriftungen, Legenden, Tooltips, Styling und responsiver Darstellung.
- AnyChart JS ermöglicht die Entwicklung anpassbarer Kreisdiagramme mit interaktiven Tooltips, konfigurierbaren Beschriftungen, hervorgehobenen Segmenten, responsiven Layouts und umfangreichen Erscheinungsoptionen.
Für eine detaillierte Analyse von Funktionen und Preisen besuchen Sie unseren Vergleich der Vue.js Chart-Komponenten.