Komplexe Daten mit Pivot-Charts visualisieren
Erstellen Sie interaktive Pivot-Charts, um zusammengefasste Daten zu visualisieren, Trends zu entdecken und eine effektive Datenanalyse zu unterstützen.
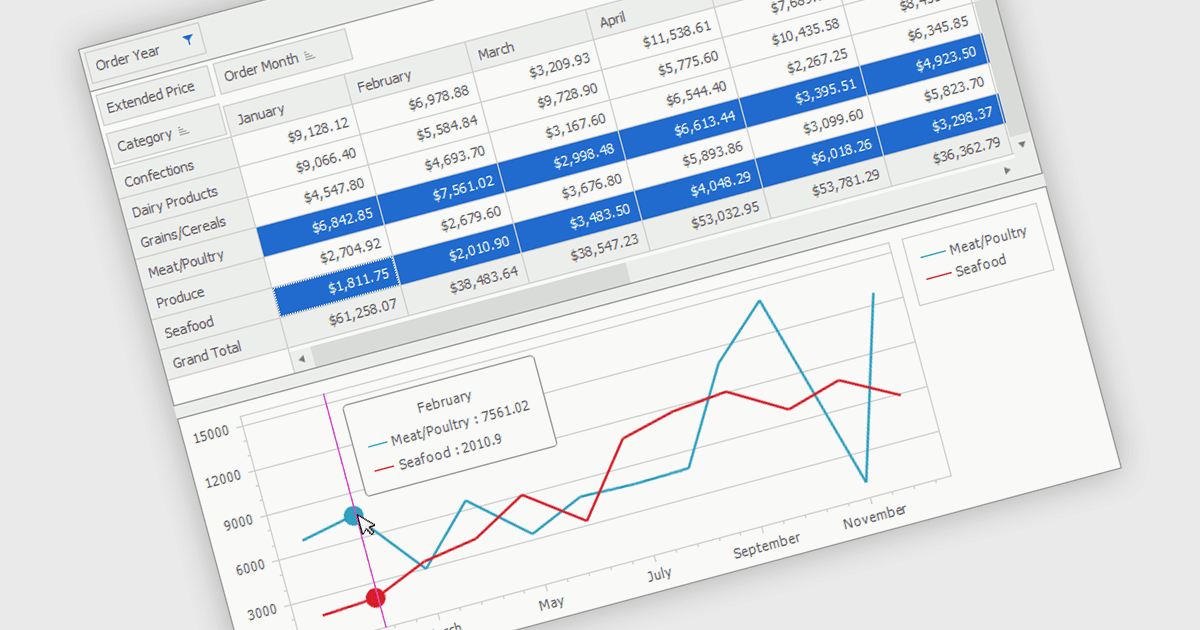
Ein Pivot-Chart ist ein interaktives Datenvisualisierungstool, das zusammen mit einer Pivot-Tabelle verwendet wird, um zusammengefasste Daten grafisch darzustellen. Es ermöglicht Benutzern, Datensätze zu analysieren, indem Kategorien, Serien und Filter dynamisch geändert werden, ohne die Quelldaten zu verändern. Durch die visuelle Darstellung von Trends, Vergleichen und Mustern machen Pivot-Charts komplexe Informationen leichter verständlich und unterstützen schnellere Entscheidungsprozesse. Sie werden häufig in Business Intelligence, Berichterstellung und Datenanalyse eingesetzt, wo eine flexible Exploration aggregierter Daten wichtig ist.
Mehrere .NET WinForms UI-Suiten bieten Pivot-Chart-Funktionalität, darunter:
- DevExpress WinForms ermöglicht es, interaktive Pivot-Charts zu erstellen, die Pivot Grid-Zusammenfassungen visualisieren, Trends aufdecken und die multidimensionale Datenanalyse vereinfachen.
- ComponentOne Studio WinForms von MESCIUS erlaubt es, Pivot-Charts aus zusammengefassten Daten zu erstellen, für eine klarere Trendanalyse und Berichterstattung.
- Syncfusion Essential Studio UI Component Suite unterstützt interaktive Pivot-Charts, die Pivot Table-Zusammenfassungen in visuelle Erkenntnisse für eine effiziente Geschäftsanalyse umwandeln.
Für eine detaillierte Analyse der Funktionen und Preise besuchen Sie unseren Vergleich der .NET WinForms UI-Suiten.