Proveedor oficial
Como distribuidores oficiales y autorizados, le suministramos licencias legítimas directamente de más de 200 editores de software.
Ver todas nuestras marcas.

Descripción: offers hundreds of chart and graph styles in 2D and 3D for data visualization, 56 mathematical, statistical and financial functions plus an unlimited number of axes and 30 Palette components. TeeGrid ... Charting and grid components for RAD Studio. TeeSuite includes a professional charting component, and an easy-to-use data grid for RAD Studio developers. TeeChart Pro charting component library ...
Notas de la versión: developers. Deliver high performance charting solutions. TeeChart Pro VCL allows you to create general purpose and specialized chart and graphing applications for all areas including business, engineering, ... Steema Software release new VCL/FMX product suite for RAD Studio developers. TeeSuite includes a professional charting component, an easy-to-use data grid and BI & analytic tools for RAD Studio ... financial, statistical, scientific, medical, real-time, and the web. TeeChart Pro VCL features a chart gallery with several chart types including 2D or 3D line, bar, horizontal bar, area, point, pie, arrow, ...

Descripción: component library offers hundreds of chart and graph styles in 2D and 3D for data visualization, 56 mathematical, statistical and financial functions plus an unlimited number of axes and 30 Palette ... Componentes de gráficos, cuadrícula y análisis para RAD Studio. TeeSuite includes a professional charting component, and an easy-to-use data grid for RAD Studio developers. TeeChart Pro charting ...
Notas de la versión: Added full support for Embarcadero RAD Studio, Delphi and C++ Builder 12 Athens. Font sizes too small when changing a non-visible chart to a high DPI screen. Exporting to PDF is faulty. Mouse move ...
Notas de la versión: Oscillator)- A technical momentum indicator that shows the relationship between two moving averages in percentage terms. New Tools Chart Layout- Provides a way to create a grid of charts inside a chart. Includes ... FormatFloat(Series1.PercentFormat, Value). The Chart Gallery now enables you to change the number of columns (or zero, for automatic layout). Ternary Series now derive from a new base class TCustomPointer3DSeries instead of directly ... from TPoint3DSeries. This optimizes code and properties that aren't usable by Ternary. Added new SaveChartToString and LoadChartFromString methods, which allow you to convert a Chart into textual ...
Notas de la versión: Added support for Embarcadero RAD Studio 11.3 Alexandria. Added a new Squarified Map Series. Axis increment strange when really smaller than the axis range. Holes of some characters are filled when using the TText3DTool. Wrong axis size in logarithmic axis. Axis labels not drawn when the series ...
Notas de la versión: exporting to JavaScript. Assigning TAxisItems Automatic property. Images with transparency not drawn correctly in Pointers when not Orthogonal chart. Some empty components in Shape series editor. ... ErrorPointSeries drawing wrong errors in logarithmic axes. Tools and Tools.Gallery editors broken in Alexandria. Dragging a component over a chart doesn't show the icon of the operation set at DragOver event. ... Changing Marks angle individually does nothing. Assign chart doesn't copy individual axis items format. TChart's SeriesUp changes TChartAxis' IsDateTime result. Legend checkboxes not scaling ...
Notas de la versión: Added full support for Embarcadero RAD Studio, Delphi and C++ Builder 12 Athens. Added new grid 'keydown' event. Added a new right-click popup menu for column trees. Use it to add 'root' columns or to enable the ability to close the dialog by pressing the Escape key. Added a new ...
Notas de la versión: interpolation. Added the ability to export chart and data to XML. Added Sides options to Violin series, so Violin series can be one sided, left, right or both. Added new Scale property for KDEFunction. Fixes Fixed ... compatibility with the TDBTree component in Delphi 10 Seattle and Windows 10. Error on attempting installation. TCircularGauge does not draw the last point on the axis. Trouble writing chart and restoring it when ... correctly in GDI. TTeePreviewPanel doesn't show any chart in FMX. Opening the series editor sets "XValues.Order" property to "loNone". Missing values in DataTable tool at Left axis. ...

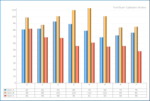
Capturas de pantalla: Cylinder Chart is a Bar chart that use cylinder shape to show data. Example of Cylinder Chart including a grid with Series data values. 0 ...

Capturas de pantalla: Sample Polar Chart showing the relationship between two data series. Polar Chart appearance can be customized using Transparency, labels position, background Gradient, smoothing function. Polar ... charts are used to present data in scientific and mathematic applications. 0 ...

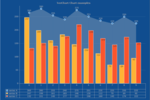
Capturas de pantalla: Combination 2D Bar and Area Chart displaying a Datagrid with Series data values. The Datagrid is a Chart tool independant of Series Type. 0 ...

Capturas de pantalla: Sample financial chart created using the MACD function (Moving Average Convergence Divergence). 0 ...

Capturas de pantalla: Displaying a Bubble Chart using semi- transparent circular elements to represent data. 0 ...

Capturas de pantalla: Add customizable charts and grids to your applications. 0 ...

Capturas de pantalla: Sample 2D Area Chart with three data sets displaying trend changes over the time combined with a Pie Series. 0 ...

Capturas de pantalla: Combination Area, Vertical Bar and Line Chart. This shot specifies a particular region of interest in data which is displayed in the magnified view. 0 ...

Capturas de pantalla: TeeChart offers many indicators specifically designed to track financial data. This is a sample of the A.D.X (Average Directional Change) function on Chart. Uses a OHLC (Candle) series as datasource ...

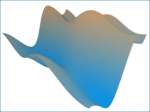
Capturas de pantalla: Surface plot after customization. Includes many properties to enhance the surface chart; color palette, border, pattern, null values, wire-frame, dots, surface sides, marks, gradients, inverted ...

Capturas de pantalla: A Surface Series that offers plots of 3 dimensional data. 0 ...