Proveedor oficial
Como distribuidores oficiales y autorizados, le suministramos licencias legítimas directamente de más de 200 editores de software.
Ver todas nuestras marcas.
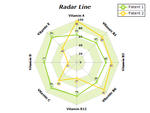
Capturas de pantalla: Radar Series, used to create a Radar Chart (Spider Chart, Star Chart), is rendered to a circular graph and is used primarily as a multi-parameter data comparison tool. ...
Funciones: used to create a Radar Chart (Spider Chart, Star Chart), is rendered to a circular graph and is used primarily as a multi-parameter data comparison tool. Surface Chart with Texture The Grid surface ... Nevron Chart for.NET comes with 170+ charting types and an online library of 400+ examples with source code which makes it without doubt a leading charting control. The component will help you add ... can take advantage of the chart’s ability to wrap a vast amount of features in an intuitive and straightforward programming model. The component features full Visual Studio design time support ...
Notas de la versión: Added support for Microsoft.NET Core 8.0- This version adds support for.NET Core 8.0 for the WinForms and WPF chart controls included in the suite. Added a new Cartesian and Pie Charts Data Labels ... Layout- This version includes a new implementation of the data labels layout for improved readability of charts containing many overlapping data labels. The new data labels layout applies to Cartesian ... and Pie charts. The pie series also features a new pie label layout (RimNoOverlap), that allows you to position the pie labels at the pie rim, without overlapping. Bug fixes for all reported problems ...
Notas de la versión: supports.NET Core 7.0 to the WinForms and WPF chart controls included in the suite. New Fast Bar, Line, and Point Series- This new version of the chart control includes three new series (Bar, Line, and Point) ...
Notas de la versión: Added support for Microsoft.NET Core 6.0- This release supports.NET Core 6.0 for the WinForms and WPF Chart controls. Bug fixes for all reported problems as well as other performance improvements ...

Descripción: Deliver rich charting functionality to your WinForms and ASP.NET applications. Nevron Chart for.NET is a leading charting solution for ASP.NET and Windows application development. Nevron Chart ... for.NET has been designed from the ground up to meet your charting requirements and wrap them in a well thought and consistent programming model. Whether you need to build business, scientific, financial ... or presentation charting enabled applications or even full featured, integrated BI solutions Nevron Chart will deliver data visualization to your WinForm or WebForm applications. Nevron Chart for.NET features: ...
Notas de la versión: Improves Heat Map labeling and contour generation. Added support for Microsoft.NET Core 5.0- This release supports.NET Core 5.0 for the WinForms and WPF Chart controls. Added support for Microsoft ... and VS2008 toolbox. New Vertex Surface Series- The Chart control now has a new surface series that allows you to plot arbitrary 3D graphics shapes, by specifying its graphics primitive and optionally indices ... and custom colors per vertex. All surface series attributes like color frames, contour lines, isolines, etc., are also supported. Improved Heat Map labeling and contour generation- The Chart control has ...
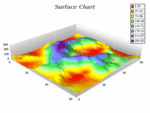
Notas de la versión: improvements in the control. Sample Triangulated Surface chart ...
Notas de la versión: Adds support for Microsoft Visual Studio 2019. Support for Visual Studio 2019 Complete integration with VS2019 for the WinForm, WPF and WebForms chart controls. In addition, it fixes problems ...
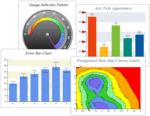
Notas de la versión: Adds new Triangulated Heat Map series, plus improved features for Vector, Bubble, Bar, Area and Pie Series charts. Triangulated Heat Map Series The Triangulated Heat Map Series adds support ... decorations (ticks, labels etc.) should be rendered in front or back of the back chart wall. Added feature to control how axis labels fit inside the chart panel bounds. You can select whether to regard the axis ... a palette object. The palette can either spread over the indicator or the current indicator palette value can be used to color the indicator. Performance Optimizations Optimized chart min max calculations ...
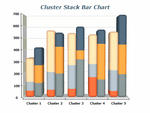
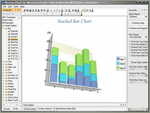
Capturas de pantalla: Clustering and stacking may be combined into the same chart. In a 3D scene, clustered and stacked series may be distributed in different depths. ...
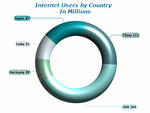
Capturas de pantalla: A pie chart may be rendered in different shapes- standard and smooth edge pie, standard, smooth edge or cut edge ring and torus, thus increasing the diversity of chart looks available ...
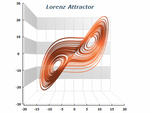
Capturas de pantalla: XYZ Line Chart representing Lorenz Attractor – a complex fractal structure corresponding to the long-term behavior of a 3-dimensional dynamic system that exhibits chaotic flow and evolving without ...
Funciones: Nevron Chart for.NET provides complete set of axis related features designed to target even the most compelling charting requirements. The axes are also largely automatic allowing you to focus ... to the left and to the right of the chart back wall; using different and, by need, synchronized scales; using grid lines and major ticks; applying different styles to axes; using stripes; staggering axis ...
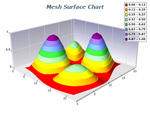
Capturas de pantalla: The Mesh Surface chart displays a surface with user-defined y-position, x-position and z-position values for each data point, in contrast to Grid Surface where only y-position (elevation) is user ...
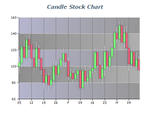
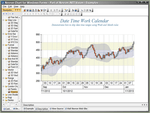
Capturas de pantalla: Candle charts are used to plot daily stock data. Each data point resembles a candle, where the candle body is formed by the open and close prices for the day. The high and low prices are displayed ...
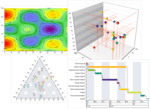
Notas de la versión: Adds new Ternary chart series, drop lines, connector lines, enhanced heat maps, plus full support for Microsoft Visual Studio 2017. Ternary Point Series- The Ternary Point series displays point ... are lines which extend from the point X, Y, Z value to the chart walls. Optionally drop lines can extend to the axis Min, Max value or to a user specified value (drop lines origin). Bar Connector Lines- ... values. In addition it also supports Gantt connector between the bar end value and one or more bars begin values. This feature allows you to easily display Gantt charts. Heat Map Contour Labels- The Heat ...
Capturas de pantalla: ...
Capturas de pantalla: ...
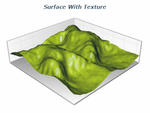
Capturas de pantalla: The Grid surface series supports a Fill Effect for the whole surface. The user can apply images, gradients, advanced gradients and patterns to the surface, as well as modify material properties like Specular Color, Emissive Color and Shininess. ...