Proveedor oficial
Como distribuidores oficiales y autorizados, le suministramos licencias legítimas directamente de más de 200 editores de software.
Ver todas nuestras marcas.

Descripción: Create great looking Graphs and Charts in Java. Big Faceless Graph Library allows you to create ... industry leading Graphs and Charts in Java. Backed by a full 3D engine, the Graph Library can plot 2D ... or shaded 3D Pie Charts, Line Graphs, Area and Bar Graphs from any viewpoint to PNG, Flash, PDF or SVG, ... Leer más Mostrar más resultados de este producto
Descripción: Cree gráficos y tablas atractivos en Java. Big Faceless Graph Library allows you to create ... industry leading Graphs and Charts in Java. Backed by a full 3D engine, the Graph Library can plot 2D or ... quickly and with stunning results. Big Faceless Graph Library Features include: XML and JSP Tag Library ... Leer más

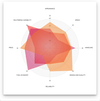
Descripción: Add Radar charts to your JavaScript apps. Vizuly Radar Chart graphs multiple dimensions of one ... This chart supports highlighting of both individual data points and the group as a whole. Features Supports ... Leer más Mostrar más resultados de este producto
Descripción: Añada gráficos de radar a sus aplicaciones JavaScript. Vizuly Radar Chart graphs multiple ... axis lines. This chart supports highlighting of both individual data points and the group as a whole. ... Leer más

Descripción: is a native VCL component designed to help you present charts, schemes, hierarchies, and graphs of any ... flow-workflow diagrams, hierarchical charts and displays, network layouts, and even your favorite city ... map.ExpressFlowChart Suite Includes a built-in Runtime Chart Editor, full drag-and-drop support, and more. ... Leer más Mostrar más resultados de este producto
Descripción: map.ExpressFlowChart Suite Includes a built-in Runtime Chart Editor, full drag-and-drop support, and more. ... Leer más

Descripción: WebAssembly Charts and Graphs- Build expressive dashboards for deep analytics, and render millions of data ... points in real time, with more than 65 high performance Blazor charts and graphs. Optimized for both ... to graph your data, including bar chart, line chart, column chart, pie chart, area chart, Treemap chart ... Leer más Mostrar más resultados de este producto
Descripción: Choose from over 65 chart types to graph your data, including bar chart, line chart, column chart, pie ... chart, area chart, Treemap chart, geospatial maps, stock charts, and much more. Even better, you get all ... charts. Axis Gridlines Axis Layouts Axis Options Chart Animations Chart Annotations Chart Highlighting ... Leer más

Descripción: Gráficos interactivos, medidores y paneles escritos en JavaScript puro. MindFusion.Charting for ... the perfect data visualization in JavaScript and HTML. MindFusion.Charting for JavaScript Features ... Support for All Common Chart Types- The JavaScript chart supports all popular chart types and their ... Leer más Mostrar más resultados de este producto
Descripción: for JavaScript combines 2D and 3D charts, financial graphs, gauges and dashboards. It includes an elegant API, ... Interactive charts, gauges and dashboards written in pure JavaScript. MindFusion.Charting ... the perfect data visualization in JavaScript and HTML. MindFusion.Charting for JavaScript Features Support ... Leer más

Descripción: of chart and graph styles in 2D and 3D for data visualization, 56 mathematical, statistical and financial ... Charting and grid components for RAD Studio. TeeSuite includes a professional charting component, ... and an easy-to-use data grid for RAD Studio developers. TeeChart Pro charting component library offers hundreds ... Leer más Mostrar más resultados de este producto
Descripción: library offers hundreds of chart and graph styles in 2D and 3D for data visualization, 56 mathematical, ... charting component, and an easy-to-use data grid for RAD Studio developers. TeeChart Pro charting component ... Leer más

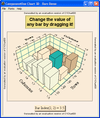
Descripción: is an enterprise charting tool that allows you to develop charts or graphs and serve them as JPEG or PNG files ... and one for 3D. The ASP web server performs the chart creation and sends the completed charts and graphs ... Create browser-independent, dynamic charts for Active Server Pages (ASP). ComponentOne WebChart ... Leer más Mostrar más resultados de este producto
Descripción: change chart types and data values. True WebChart features two server-side charting components- one for ... Applications ComponentOne WebChart gives you the same charting power as Olectra Chart but in an ASP ... Olectra Chart ActiveX controls. The Active Server Page (ASP) communicates with the server-side charting ... Leer más
Soporte: ComponentOne Platinum Support Subscriptions provide a full year of Telephone and Online Technical Support. ComponentOne Technical Support Engineers are available by phone Monday through Friday, except U.S. holidays, from 9:00 a.m. to 5:00 p.m. Eastern,USA. Customers outside the USA, please remember ... Leer más

Descripción: chart Line chart Lollipop chart Network graph Organization chart Packed bubble Parallel coordinates ... Scatter chart Spline chart Stream graph Sunburst Timeline chart Treegraph chart Treemap Variable radius ... Data visualization, charts, and diagrams for web pages and web applications. Highcharts ... Leer más Mostrar más resultados de este producto
Descripción: Heatmap Histogram Item chart Line chart Lollipop chart Network graph Organization chart Packed bubble ... Sankey diagram Scatter chart Spline chart Stream graph Sunburst Timeline chart Treegraph chart Treemap ... the industry-leading JavaScript charting library. Highcharts is used by tens of thousands of ... Leer más

Descripción: high-performance 2D and 3D charts and graphs. Now with 2D and 3D Unicode controls for National Language Support. ... Create and customize virtually any type of chart. ComponentOne Chart provides hundreds ... of properties and methods to create an unlimited variety of charts with variations of color, style annotations, ... Leer más Mostrar más resultados de este producto
Descripción: is 64-bit compatible. ComponentOne Chart (formerly Olectra Chart) is a charting tool to easily ... Create and customize virtually any type of chart. ComponentOne Chart provides hundreds of ... ComponentOne Chart supports data binding to any data source, allows you to use bitmap or metafiles as ... Leer más
Soporte: ComponentOne Support is offered in Standard or Platinum levels. Standard Support Includes: Access to hotfix builds ComponentOne Blogs ComponentOne Forums Access to 3 major releases per year Online Support Email Project for Analysis Platinum Support Adds: 24 Hour FastTrack Response (excluding ... Leer más

Descripción: improve scheduling and improve business outcomes before committing funds to a project. Charts and Graphs ... Enterprise Architect uses charts and graphs to help visualize the results of various simulations. Report data ... the charts, reports and insight gathered from running a business process simulation to enhance decision making ... Leer más Mostrar más resultados de este producto
Descripción: various simulations. Report data can become input for a chart element. Compare and contrast the results ... Leer más