Proveedor oficial
Como distribuidores oficiales y autorizados, le suministramos licencias legítimas directamente de más de 200 editores de software.
Ver todas nuestras marcas.

Capturas de pantalla: Graph chart showing social network of a person. ... Leer más Mostrar más resultados de este producto
Capturas de pantalla: Radial graph chart with expandable nodes showing social network. ... Leer más
Capturas de pantalla: Radial graph chart displaying all data showing category based data. ... Leer más

Notas de la versión: New component lets you add React Native charts and graphs to Android and iOS applications. React ... reactive. All charts and graphs are tested and built for millions of data points without any performance ... Native Component For FusionCharts With the new component, developers can add React Native charts ... Leer más Mostrar más resultados de este producto
Descripción: Spark Win/Loss Bullet Graphs Horizontal bullet graph Vertical bullet graph Other Charts Funnel Chart ... JavaScript (HTML5) charts and gauges that work across multiple devices and platforms. FusionCharts ... and responsive charts. From simple charts like line, column, and pie to domain-specific charts like heatmaps, ... Leer más
Notas de la versión: for Stacked Column chart. The background color of the Thermometer graph is now properly updated ... Updates in v3.13.1 Fixes... Chart was throwing runtime error while changing ... the 'chartType'. When map alias was prefixed with a path (e.g. ‘maps/’) drill down chart failed to render the maps. ... Leer más

Notas de la versión: (Winform/Wpf) when run as 64 bit. Fixes Direct3D 2D charts Graph and Scientific Graph real-time updating ... with AppendYData. Adds support for Direct3D 2D charting Graph and Scientific Graph zooming while real-time updating. ... MinimumSize feature to override the 75 pixel minimum control size to help with placing dozens of charts ... Leer más Mostrar más resultados de este producto
Notas de la versión: Fixed an issue where the new virtual data mechanism (9.5) would not chart the first data point ... zoombox to their respective far edges. Now the chart will undo the zoom state in this case. Fixed an issue ... Leer más
Descripción: , Scientific Graph, 3D Scientific Graph, Polar, and Pie Chart objects. GigaSoft ProEssentials comes ... Add financial, scientific, engineering and business charts to your applications. GigaSoft ... ProEssentials is a set of charting components for both Windows client-side and server-side development. GigaSoft ... Leer más

Capturas de pantalla: to automatically display graphs or flow charts following aesthetic rules. ... Leer más Mostrar más resultados de este producto
Descripción: to automatically display graphs or flow charts following some aesthetic rules. Includes: HFlow (hierarchical), ... A set of graph drawing algorithms. LayoutFlow is a collection of 4 layout components to enable you ... of these controls allows performing a graph layout automatically, positioning its vertices (also called nodes) ... Leer más
Capturas de pantalla: that performs a symmetric layout on a grap, TFlow that allows performing a tree layout on a graph and OFlow ... to perform an orthogonal layout on a graph. ... Leer más

Descripción: is an enterprise charting tool that allows you to develop charts or graphs and serve them as JPEG or PNG files ... and one for 3D. The ASP web server performs the chart creation and sends the completed charts and graphs ... Create browser-independent, dynamic charts for Active Server Pages (ASP). ComponentOne WebChart ... Leer más Mostrar más resultados de este producto
Funciones: so you can: Serve any Olectra Chart or graph as JPEG or PNG to any browser Serve charts as an ActiveX ... writing a single line of code Intelligent update for fast, real-time charting and tracking Built-in ... your high-performance 2D and 3D charts, ComponentOne WebChart's web server technology takes over ... Leer más
Descripción: change chart types and data values. True WebChart features two server-side charting components- one for ... Applications ComponentOne WebChart gives you the same charting power as Olectra Chart but in an ASP ... Olectra Chart ActiveX controls. The Active Server Page (ASP) communicates with the server-side charting ... Leer más

Notas de la versión: Chart. Pareto Chart. Sankey Chart. 3D Scatter Chart. Stream Graph. Sunburst. Variable Pie. Variwide. ... Expanded collection of charts, client-side analytics, annotations, and a massive performance ... boost. Added Annotations module for annotating a chart with labels or shapes. Added the Boost module ... Leer más Mostrar más resultados de este producto
Descripción: chart Line chart Lollipop chart Network graph Organization chart Packed bubble Parallel coordinates ... Scatter chart Spline chart Stream graph Sunburst Timeline chart Treegraph chart Treemap Variable radius ... Data visualization, charts, and diagrams for web pages and web applications. Highcharts ... Leer más
Capturas de pantalla: Bullet graph (Sand Signika theme) Leer más

Descripción: high-performance 2D and 3D charts and graphs. Now with 2D and 3D Unicode controls for National Language Support. ... Create and customize virtually any type of chart. ComponentOne Chart provides hundreds ... of properties and methods to create an unlimited variety of charts with variations of color, style annotations, ... Leer más Mostrar más resultados de este producto
Informe de cliente: a few days looking at the examples you will see what a truly flexible charting control this is. I have ... have also not yet found a way of drawing a trendline (a manual one) on the graphs. All in all a good ... Leer más
Descripción: is 64-bit compatible. ComponentOne Chart (formerly Olectra Chart) is a charting tool to easily ... Create and customize virtually any type of chart. ComponentOne Chart provides hundreds of ... ComponentOne Chart supports data binding to any data source, allows you to use bitmap or metafiles as ... Leer más

Descripción: with 64-bit support. Chart Controls Create sophisticated charts and graphs with fast, real-time tracking ... charting tool that allows you to develop charts or graphs and serve them as JPEG or PNG files to any ... The ASP web server performs the chart creation and sends the completed charts and graphs to the browser. ... Leer más Mostrar más resultados de este producto
Descripción: Classic Edition, VSVIEW Reporting, Chart, WebChart, Query, True DataControl, True DBInput Pro, True DBList ... included in the suite (VSFlexGrid, VSView Reporting, Query and Chart). ComponentOne Studio ActiveX Edition ... currently includes True DBGrid Pro, VSFlexGrid Pro, VSVIEW Classic Edition, VSVIEW Reporting, Chart ... Leer más
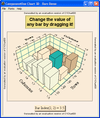
Capturas de pantalla: Create browser-independent, dynamic charts for Active Server Pages (ASP) and VB Applications using ... ComponentOne WebChart or ComponentOne Chart ... Leer más

Descripción: a complete collection of charts and graphs for professional data visualization. It also comes with advanced ... to generate a wide array of charts for your browser based applications. jChartFX Plus Features Adaptive- ... you customize virtually any chart element. Browsers- jChartFX Plus is a browser-based charting engine ... Leer más Mostrar más resultados de este producto
Descripción: laid out API, jChartFX Plus lets you customize virtually any chart element. Browsers- jChartFX Plus is ... a browser-based charting engine that takes advantage of the HTML 5 standard to render locally without any server ... a single API call. jChartFX Plus Chart Types Bar Charts Stacked Bar Charts 3D Bar Charts Area Charts Line ... Leer más
Precios: jChartFX Plus- Development License + Support Development License Only, No Deployment, 1 Year Technical Support subscription included. Development License + Support Mfr. Part No: JCFX70DS Our Part No: 545731-1342771 jChartFX Plus- Single-Domain License Deployment for a Single Domain (Subdomains ... Leer más

Descripción: technologies. 3DChart uses the OpenGL 3D graphics engine to create sophisticated 2D and 3D charts and graphs ... Create attractive 3D and 2D charts for client applications and web pages using COM or.NET ... that can incorporate still or animated images. 3DChart includes a standalone application for chart template ... Leer más Mostrar más resultados de este producto
Descripción: that can incorporate still or animated images. 3DChart includes a standalone application for chart ... you have in charting you will literally be able to create complex charts in hours. With 87 objects ... containing 557 properties and 442 methods 3DChart is definitely the most powerful charting tool available on ... Leer más
Capturas de pantalla: Pie Charts Leer más