Compare Gráficos .NET y JavaScript
Evalúe y compre los gráficos más vendidos en minutos.
Diseñado específicamente para que los desarrolladores preseleccionen productos por función, plataforma y precio.

Descripción: Represent transactional relationships from a specified number of sources to a variable number of targets. Vizuly Halo uses several different data visualization techniques to represent transactional relationships from a specified number of sources to a ... Leer más

Descripción: Represent cartesian x/y data within a radial plot. Vizuly Radial Bar is designed to represent cartesian x/y data within a radial plot. It supports both clustered and stacked radial bars Use the interactive style explorer on the left to view different ... Leer más
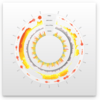
Descripción: Easily display multi-variate time series information. Vizuly Ring Chart lets you easily display multi-variate time series information. Due to its radial form factor, you can display 3 times the information for a given screen width than you could with a ... Leer más

Descripción: Add stacked and clustered bar charts to your JavaScript apps. Vizuly Bar Chart supports both stacked and clustered layout options, as well as over 2 dozen different dynamic styles. It also comes bundled with a test container and examples of different ... Leer más

Descripción: Add stacked and clustered column charts to your JavaScript apps. Vizuly Column Chart supports both stacked and clustered layout options, as well as over 2 dozen different dynamic styles. It also comes bundled with a test container and examples of ... Leer más
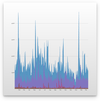
Descripción: Add line and area charts to your JavaScript apps. Vizuly Line Area Chart supports both line and area plots in several different layout options. It also comes bundled with a test container demonstrating the various chart properties and different style ... Leer más
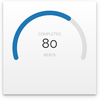
Descripción: Show numeric values within a minimum and maximum range. Vizuly Radial Progress is designed to show numeric values within a minimum and maximum range. It can also show when a value has exceeded the maximum threshold. This chart supports a variable range of ... Leer más
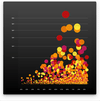
Descripción: Add Scatter Plot charts to your JavaScript apps. Vizuly Scatter Plot shows 3 dimensions of data at once by plotting values along both the x and y axis as well as the radius of the plot itself. Each plot can be colored and styled dynamically based on your ... Leer más
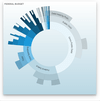
Descripción: Adds Sunburst charts to your JavaScript apps. Vizuly Sunburst is designed to represent hierarchical data in a radial plot. It supports drill down and drill up capabilities by allowing the user to collapse and expand segments of the sunburst when they ... Leer más
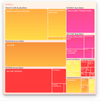
Descripción: Add Tree Map charts to your JavaScript apps. Vizuly Tree Map visualizes hierarchical data in nested rectangular plots where the area of each rectangle is bound to a data property you can set. This TreeMap also supports the ability to drill down/up, in ... Leer más