Ajouter des graphiques en chandeliers à vos applications WinForms
Les graphiques en chandeliers capturent visuellement l’évolution des prix, l’ouverture/la clôture, ainsi que les plus hauts et les plus bas, révélant le sentiment du marché et des opportunités de trading.
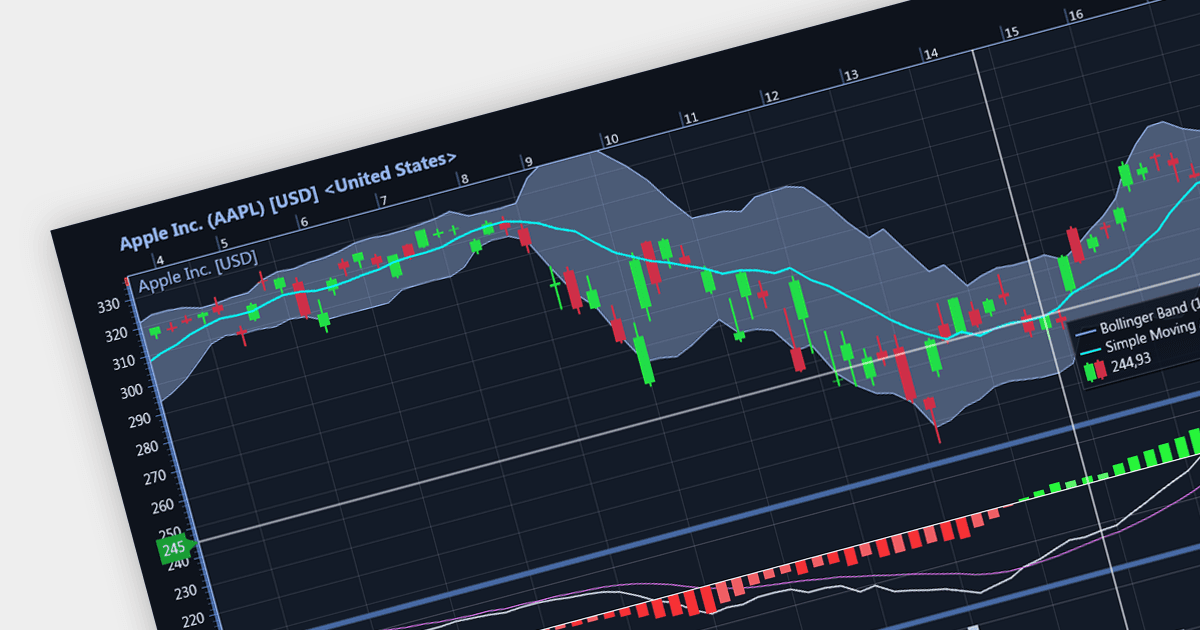
Les graphiques en chandeliers sont un type de graphique financier utilisé pour décrire les variations de prix d’un titre, d’un produit dérivé ou d’une devise. Chaque « chandelier » affiche généralement une journée, la « boîte » centrale représentant l’intervalle entre les cours d’ouverture et de clôture, tandis que les lignes indiquent les plus hauts et les plus bas. Leur format visuel unique aide les traders à comprendre rapidement le sentiment du marché.
Plusieurs contrôles de graphiques WinForms proposent des graphiques en chandeliers, notamment :
- DevExpress WinForms Chart (part of DevExpress WinForms) offre un contrôle de précision sur chaque aspect des chandeliers, des ombres aux mèches, idéal pour l’analyse technique.
- ComponentOne Charts for WinForms (part of ComponentOne Studio WinForms) inclut des modèles de chandeliers intégrés et des indicateurs financiers qui accélèrent l’analyse du marché.
- Telerik Windows Forms ChartView (part of Telerik UI for WinForms) propose un rendu des chandeliers rationalisé avec un zoom/pan fluide, idéal pour les plateformes de trading dynamiques.
- Syncfusion WinForms Chart (part of Syncfusion Essential Studio Enterprise) offre de nombreuses options de personnalisation qui vous permettent d’adapter les chandeliers à vos besoins de trading.
- LightningChart .NET fournit des mises à jour rapides des chandeliers qui vous gardent en avance sur le marché, parfait pour les tableaux de bord de trading en temps réel.
Pour une analyse approfondie des fonctionnalités et des prix, consultez notre comparaison des contrôles de graphiques WinForms.