Illustrer et prédire les tendances dans les données de graphiques
Les courbes de tendance permettent de discerner des schémas et de prédire les mouvements futurs dans les données de graphiques, en aidant à la prise de décision dans divers domaines.
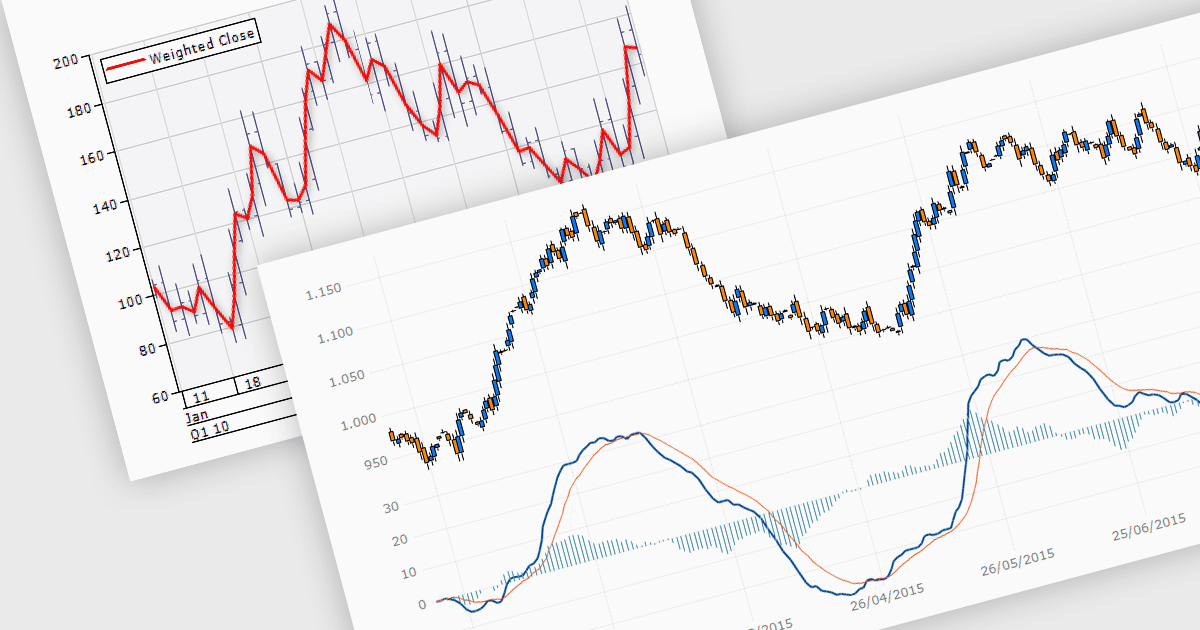
Les courbes de tendance sont des outils essentiels dans la visualisation des données et l’analyse financière, utilisés pour identifier et interpréter la direction et la force des tendances dans des ensembles de données. Une courbe de tendance est une ligne qui représente au mieux les données sur un graphique, en mettant en évidence la direction générale sur une période donnée. Elle est utile pour prendre des décisions éclairées, prédire les mouvements futurs des prix et valider la force des tendances en cours. En analyse boursière, une courbe de tendance peut aider les investisseurs à déterminer les points d’entrée et de sortie optimaux, tandis que les moyennes mobiles peuvent signaler des opportunités d’achat ou de vente, améliorant ainsi l’efficacité des stratégies de trading.
Plusieurs contrôles de graphiques .NET WinForms proposent des courbes de tendance et des indicateurs, notamment :
- DevExpress WinForms Chart (fait partie de DevExpress WinForms) permet une analyse précise des tendances grâce à des courbes de tendance personnalisables pour une meilleure interprétation des données.
- ComponentOne Charts for WinForms (fait partie de ComponentOne Studio WinForms Edition par MESCIUS) offre des fonctionnalités robustes de courbes de tendance pour rationaliser l’analyse.
- Nevron Chart for WinForms (fait partie de Nevron Chart for .NET) propose des capacités avancées de courbes de tendance, idéales pour une prévision détaillée.
- TeeChart WinForms (fait partie de TeeChart for .NET par Steema Software) facilite l’utilisation de plusieurs courbes de tendance, améliorant la précision et la clarté des tendances des données dans les graphiques.
- Infragistics Windows Forms Charts (fait partie d’Infragistics Professional) vous permet d’intégrer des courbes de tendance sophistiquées, ce qui rend les données complexes plus faciles à analyser.
Pour une analyse approfondie des fonctionnalités et des prix, consultez notre comparaison des contrôles de graphiques .NET WinForms.