Animer les graphiques dans les applications Vue.js
L’utilisation de l’animation permet aux développeurs de créer des graphiques plus engageants qui facilitent une meilleure compréhension et interprétation des données.
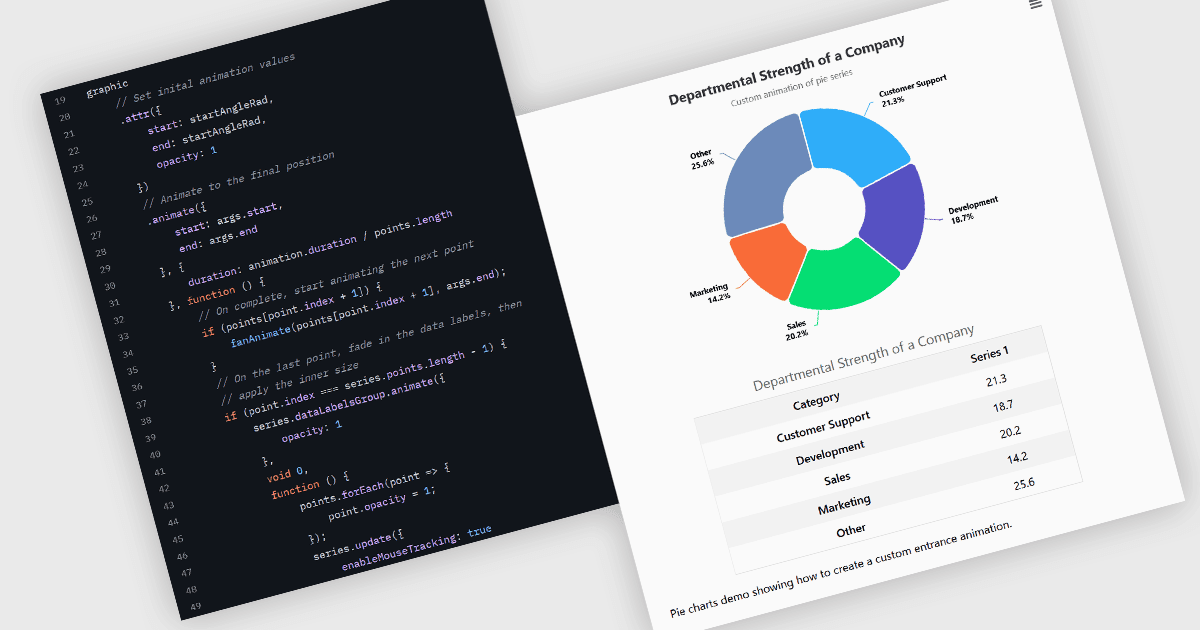
L’animation dans les graphiques est une fonctionnalité utilisée dans la visualisation de données pour assurer une transition visuelle entre différents états ou configurations des données. Cette technique aide à communiquer les changements dans les données au fil du temps ou entre les interactions utilisateur, de manière fluide et progressive. Plutôt que de passer instantanément d’un état à un autre, l’animation introduit un mouvement qui peut guider l’attention des utilisateurs, renforcer les schémas et réduire la confusion. Elle est particulièrement utile dans les tableaux de bord interactifs et l’analytique en temps réel, où les utilisateurs bénéficient d’une compréhension plus claire de ce qui a changé et de la manière dont cela se produit.
Plusieurs composants de graphiques Vue.js prennent en charge l’utilisation d’animations, notamment :
- DevExtreme Chart (faisant partie de DevExtreme par DevExpress) propose des composants Vue haute performance pour la visualisation de données qui intègrent des options d’animation configurables.
- Wijmo FlexChart and FinancialChart (faisant partie de Wijmo par MESCIUS) intègre divers modes d’animation et des contrôles de synchronisation pour visualiser les données dans des applications web.
- Highcharts Core de Highsoft est une bibliothèque de graphiques JavaScript qui peut doter les applications Vue.js de fonctionnalités d’animation avancées pour mettre en évidence les données et faciliter leur interprétation.
- Kendo UI for Vue Chart (faisant partie de Kendo UI par Telerik) propose des animations intégrées qui réagissent aux changements de données en temps réel, créant des transitions engageantes par défaut.
Pour une analyse approfondie des fonctionnalités et des prix, consultez notre comparaison des composants de graphiques Vue.js.