








Fournisseur officiel
Comme nous somme les distributeurs officiels et autorisés, nous vous fournissons des licences légitimes directement à partir de 200+ éditeurs de logiciels.
Voyez toutes nos marques.
Continuer de lire en anglais:
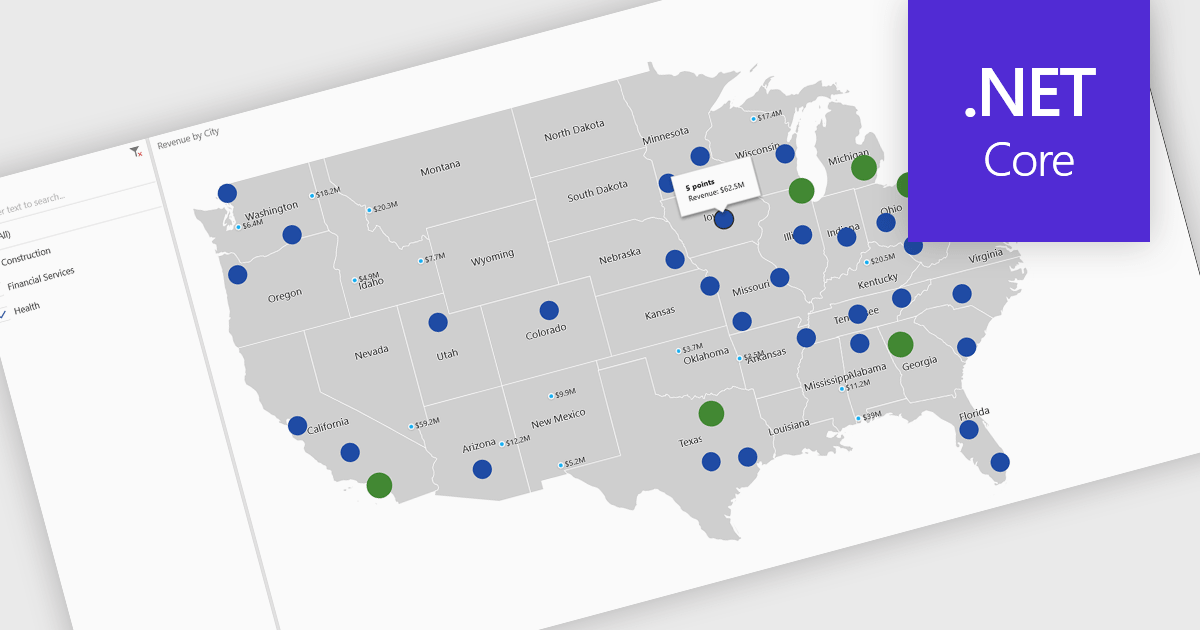
A map chart is a visual representation of data that displays values across geographic regions using colors, shading, or markers, making complex information easier to interpret. By placing data in a spatial context, map charts help users quickly identify regional patterns, trends, and outliers that might be overlooked in traditional tables or graphs. They are particularly useful for comparing values across countries, states, or counties, enabling clearer insights into geographically distributed data. Common use cases include illustrating population density, highlighting election results, analyzing sales performance by region, and presenting economic indicators. The key benefits of map charts include their ability to simplify complex datasets, provide intuitive comparisons, and support data-driven decision-making by visually connecting numbers with real-world locations.
Several .NET Core chart controls offer map charts including:
For an in-depth analysis of features and price, visit our .NET Core chart controls comparison.





Tél : (888) 850 9911
Fax : +1 770 250 6199


