


Fournisseur officiel
Comme nous somme les distributeurs officiels et autorisés, nous vous fournissons des licences légitimes directement à partir de 200+ éditeurs de logiciels.
Voyez toutes nos marques.
Continuer de lire en anglais:
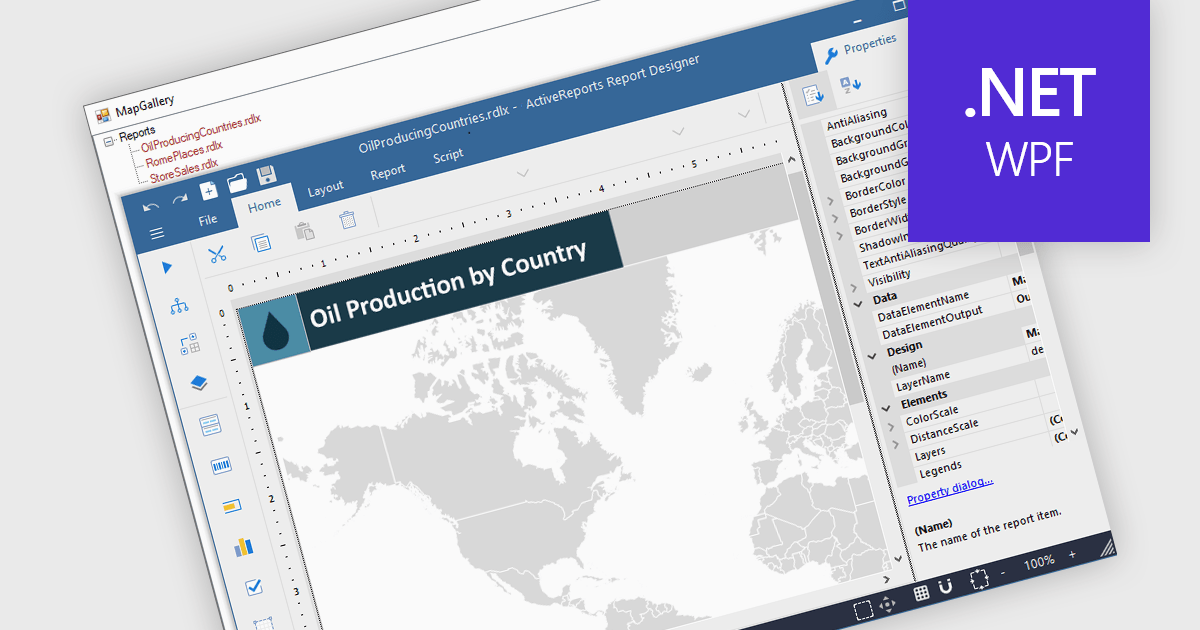
Maps in reports enable data to be visualized geographically, turning raw numbers into clear, location-based insights that are easy to interpret. By integrating maps, reports can highlight regional trends, patterns, and relationships that might be overlooked in traditional charts or tables. This spatial perspective supports better decision-making by revealing where performance is strongest, where opportunities exist, and where challenges may be emerging. Common use cases include visualizing sales performance by region, tracking service coverage areas, monitoring logistics routes, and presenting demographic or environmental data. Incorporating maps adds depth, context, and visual appeal, making reports more informative and engaging for any audience.
Several .NET WPF reporting controls offer maps, including:
For an in-depth analysis of features and price, visit our comparison of .NET WPF reporting controls.


Tél : (888) 850 9911
Fax : +1 770 250 6199


