Découvrez des informations grâce au zoom interactif des graphiques
Examinez plus attentivement les points de données critiques, en réduisant la complexité visuelle et en permettant une analyse précise des tendances sur même les jeux de données les plus complexes.
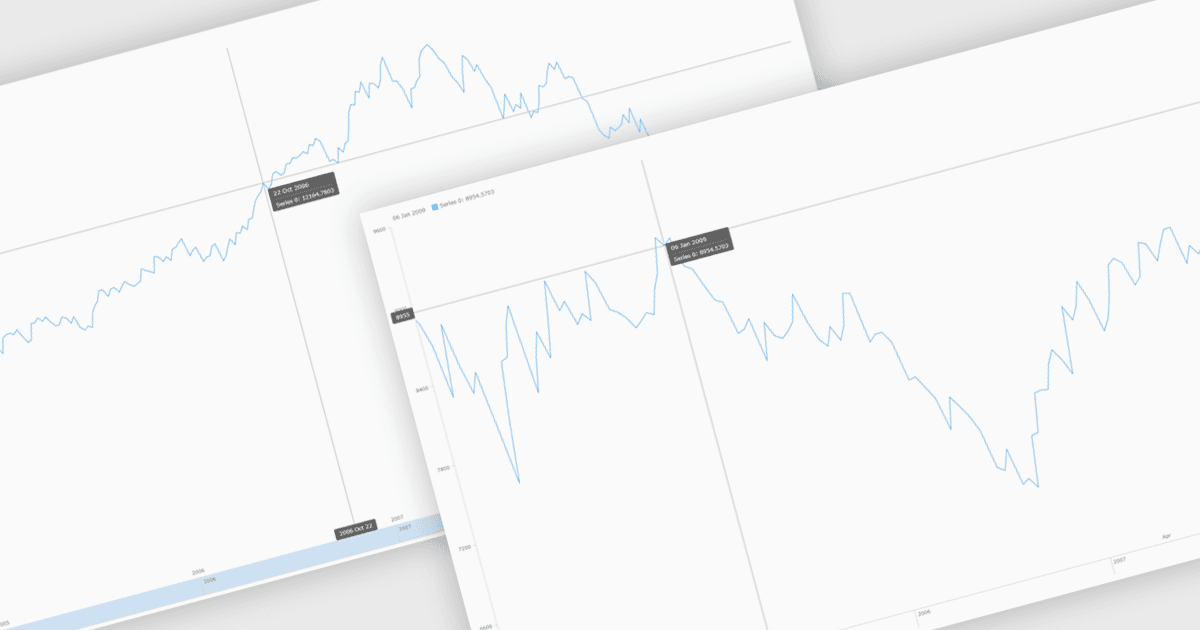
Le zoom du graphique permet aux utilisateurs d’ajuster interactivement la plage visible d’un graphique afin de se concentrer sur des points de données spécifiques, des périodes de temps ou des plages de valeurs pour une analyse plus approfondie. En permettant aux utilisateurs de zoomer avant et arrière de manière dynamique, il réduit l’encombrement visuel, améliore la clarté et aide à mettre en évidence des tendances, des anomalies ou des schémas qui peuvent être difficiles à identifier dans une vue à pleine échelle. Cette capacité interactive favorise une prise de décision plus rapide et mieux informée en permettant de passer des aperçus de haut niveau aux informations détaillées sans recharger les données. Les cas d’utilisation courants incluent l’analyse des performances financières sur des périodes spécifiques, l’examen des pics ou des baisses des indicateurs opérationnels, la consultation de données détaillées de capteurs ou de surveillance, et la mise en avant de segments clés de données pendant des présentations ou des revues avec des parties prenantes.
Plusieurs contrôles de graphiques JavaScript prennent en charge le zoom, notamment :
- Highcharts Core vous permet de zoomer de façon interactive sur des graphiques pour explorer des ensembles de données denses, isoler des plages de temps et analyser des tendances avec des contrôles réactifs.
- KendoReact Charts (partie de KendoReact par Telerik) permet de zoomer avec précision, aidant les applications à fournir des informations plus claires grâce à une exploration ciblée des données.
- AnyChart JS facilite un zoom intuitif des graphiques, permettant aux utilisateurs d’examiner des segments de données détaillés tout en maintenant les performances, la flexibilité et la clarté visuelle.
- LightningChart JS vous permet d’effectuer un zoom de graphique hautes performances pour des ensembles de données à grande échelle, en prenant en charge l’analyse en temps réel avec des exigences de précision et de réactivité.
Pour une analyse approfondie des fonctionnalités et des tarifs, consultez notre comparaison des JavaScript Charts.