Mettez en évidence les tendances avec des graphiques en carte thermique
Utilisez une représentation des données basée sur la couleur pour révéler des motifs et des anomalies au sein de jeux de données de type matriciel dans un composant de graphique.
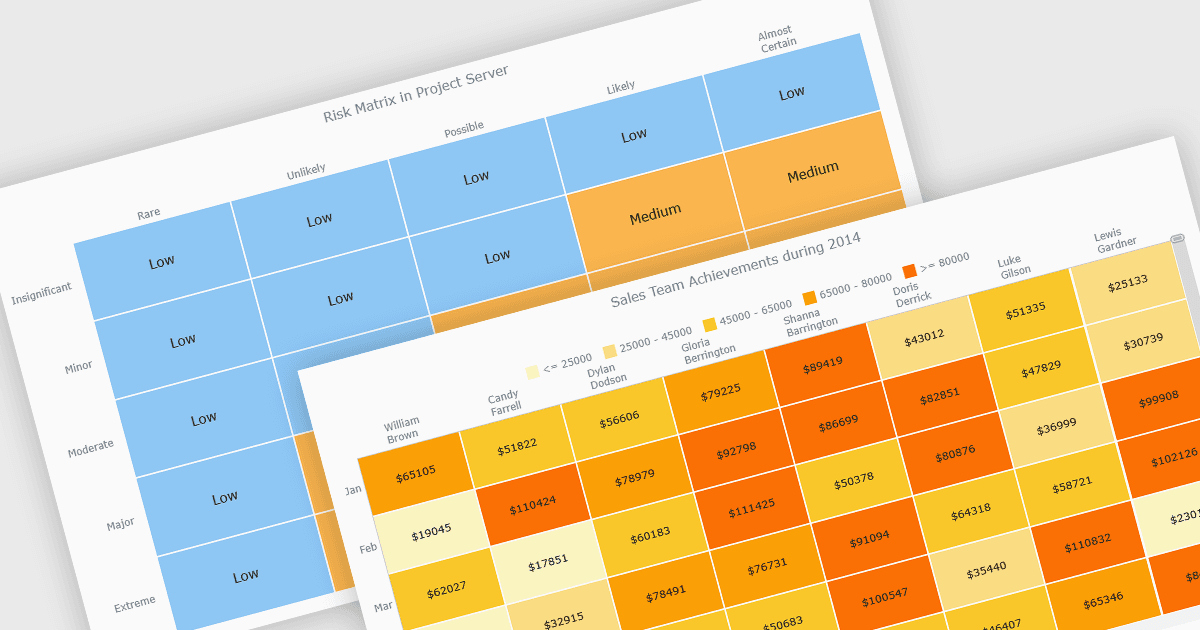
Une carte thermique est une visualisation de données qui affiche des valeurs dans une grille de cellules colorées, où l'intensité de la couleur représente l'ampleur ou l'importance des données. Cette approche permet d'identifier rapidement des motifs, des tendances et des valeurs aberrantes qui peuvent être difficiles à voir dans des tableaux traditionnels. Les cartes thermiques améliorent l'analyse des données en mettant visuellement en évidence les relations entre deux variables et en permettant des comparaisons rapides entre différents jeux de données. Elles sont couramment utilisées dans les matrices de risques, le suivi des performances, l'analyse des ventes et le suivi du comportement des utilisateurs, où des informations codées par couleur aident les utilisateurs à se concentrer sur les informations les plus importantes.
Plusieurs contrôles de graphiques JavaScript prennent en charge les types de graphiques de carte thermique, notamment :
- Highcharts Core by Highsoft vous permet de créer des heatmaps interactives qui visualisent des données matricielles avec des valeurs codées par couleur, révélant des motifs, des tendances et des comparaisons entre les catégories.
- LightningChart JS vous permet de restituer des heatmaps hautes performances pour de grands jeux de données, en utilisant l'accélération GPU pour révéler en temps réel des motifs, des intensités et des corrélations.
- AnyChart JS facilite la création de heatmaps personnalisables qui transforment des données tabulaires en grilles codées par couleur, aidant les utilisateurs à détecter les tendances, les corrélations et la répartition des données.
- JSCharting vous permet de créer des heatmaps interactives qui mettent en évidence l'intensité des valeurs grâce à des plages de couleurs, permettant une comparaison rapide, la découverte de motifs et une analyse intuitive.
Pour une analyse approfondie des fonctionnalités et des prix, consultez notre comparaison des contrôles de graphiques JavaScript.