


Fournisseur officiel
Comme nous somme les distributeurs officiels et autorisés, nous vous fournissons des licences légitimes directement à partir de 200+ éditeurs de logiciels.
Voyez toutes nos marques.
Continuer de lire en anglais:
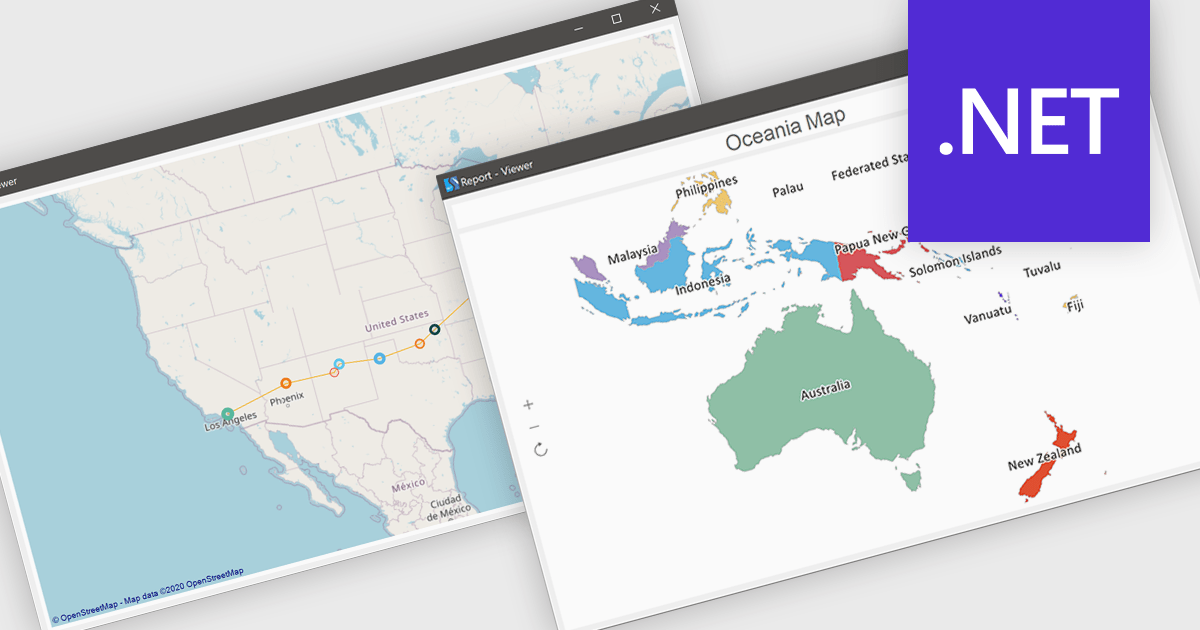
Maps in reports enable data to be visualized geographically, allowing information to be presented in the context of location rather than in traditional tables or charts. By transforming complex datasets into intuitive map-based visuals, this feature makes it easier to identify regional trends, compare performance across territories, and uncover patterns that might otherwise go unnoticed. It enhances data storytelling by providing a clear and engaging way to communicate insights, while also supporting faster, more informed decision-making. Common use cases include analyzing sales performance by region, tracking customer demographics, monitoring delivery logistics, and evaluating market opportunities across different areas.
Several .NET reporting controls offer maps, including:
For an in-depth analysis of features and price, visit our comparison of .NET reporting controls.


Tél : (888) 850 9911
Fax : +1 770 250 6199


