Visualisez des Données Complexes avec des Graphiques Croisés Dynamiques
Créez des graphiques croisés dynamiques interactifs pour visualiser des données résumées, révéler des tendances et soutenir une analyse de données efficace.
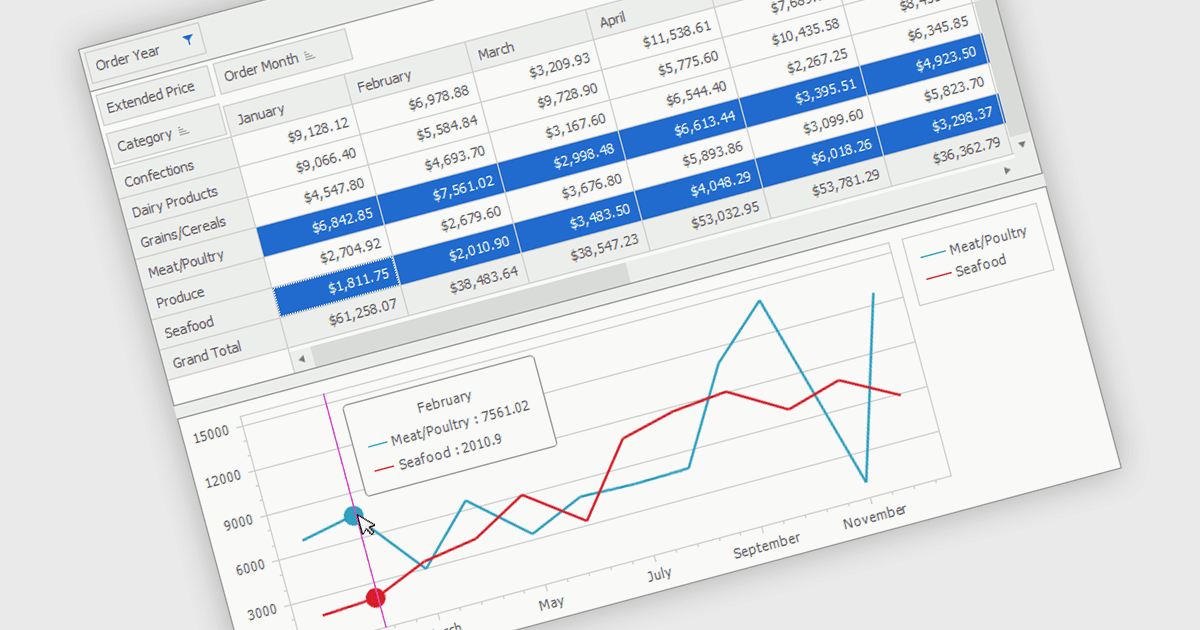
Un graphique croisé dynamique est un outil de visualisation de données interactif qui fonctionne en association avec un tableau croisé dynamique pour afficher des données résumées sous forme graphique. Il permet aux utilisateurs d'analyser des ensembles de données en modifiant dynamiquement les catégories, les séries et les filtres sans altérer les données source. En présentant visuellement les tendances, comparaisons et motifs, les graphiques croisés dynamiques facilitent l'interprétation d'informations complexes et favorisent une prise de décision plus rapide. Ils sont largement utilisés en intelligence d'affaires, reporting et analyse de données où une exploration flexible des données agrégées est importante.
Plusieurs suites UI .NET WinForms offrent des fonctionnalités de graphiques croisés dynamiques, notamment :
- DevExpress WinForms vous permet de créer des graphiques croisés dynamiques interactifs visualisant les résumés de Pivot Grid, révélant les tendances et simplifiant l’analyse multidimensionnelle des données.
- ComponentOne Studio WinForms de MESCIUS permet de créer des graphiques croisés dynamiques à partir de données résumées pour une analyse des tendances et des rapports plus clairs.
- Syncfusion Essential Studio UI Component Suite facilite des graphiques croisés dynamiques interactifs qui transforment les résumés de Pivot Table en informations visuelles pour une analyse métier efficace.
Pour une analyse approfondie des fonctionnalités et des prix, consultez notre comparaison des suites UI .NET WinForms.