
LightningChart JS
Graphiques JavaScript 2D et 3D ultra-rapides, interactifs et réactifs.
Publié par LightningChart
Distribué par ComponentSource depuis 2021
Prix à partir de : $ 2,695.00 Version : v8.3.2 NOUVEAU Mise à jour : Jun 16, 2026
Graphiques JavaScript 2D et 3D ultra-rapides, interactifs et réactifs.
Publié par LightningChart
Distribué par ComponentSource depuis 2021
Prix à partir de : $ 2,695.00 Version : v8.3.2 NOUVEAU Mise à jour : Jun 16, 2026

LightningChart JS is a WebGL-based, GPU accelerated and cross-platform charting library that has been developed to deliver outstanding performance for the most demanding data-driven applications. Performance is up to 10M+ of data points in real-time. LightningChart's charting library combines incredible speed with sturdy load capacity. Optimized for demanding industries like engineering, healthcare engineering and medical devices, industrial process control, and scientific use. LightningChart JS includes several framework application development templates for technologies such as iOS, Android, React, Vue JS, ASP.NET, Blazor, Xamarin and more.


Image 1/5
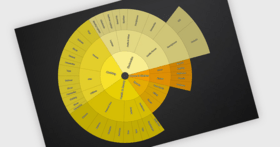
LightningChart JS Offers an Intuitive User Experience LightningChart JS charting library is an advanced data visualization solution for web applications development providing UI touchscreen interactions, a high DPI rendering support, legend boxes, server-side rendering, fluid animations and currently, a visualization capacity of 10 million data points in real-time.


Discutez en direct avec l'un de nos spécialiste des licences LightningChart .


Tél : (888) 850 9911
Fax : +1 770 250 6199


