À propos de MindFusion.Charting for WinForms

Un contrôle de tableau de bord intelligent, offrant un ensemble riche de graphiques et jauges hautement personnalisables.

MindFusion.Charting for WinForms lets you easily add charts, gauges and dashboards to your applications. Each chart type supports an unlimited number of series and can be fully customized. Each axis includes its own set of appearance settings and the control supports different labels for each chart type. Charts can read data from XML, database tables, DateTime values and numeric arrays.

MindFusion.Charting for WinForms Features

Charting for WinForms Component

  • Redistribution is royalty free.
  • Assembly is strong-named.
  • Is digitally signed.
  • Can be purchased with source code.
  • Is written in C#.

Dashboard

  • Arrange plots and gauges in a dashboard.
  • Dynamic layout system.
  • Show multiple axes on each side of a plot.
  • Text and image components.
  • Each component can be placed inside border.
  • Show multiple legends.

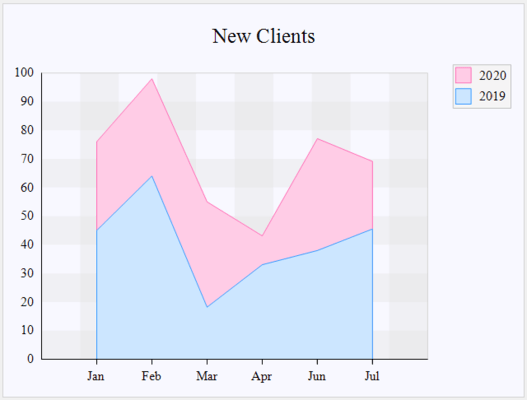
Line/Area Charts

  • No limits for the count of graphics per chart.
  • Straight lines or curves.
  • Separate as well stacked graphics.
  • Step charts.
  • Scatter graphics with shapes at data points.
  • Multiple axes.
  • Associate data series with axis.

Bar Charts

  • Drawing of bar series in rows or columns.
  • Stacked bars.
  • Groups and clusters of bars.
  • Candlestick charts.
  • Bar width relative to available space.
  • Labels inside and/or at the top of bars.
  • 3D bar charts.
  • Five different axes labels types.
  • Multiple axes.

Pie Charts

  • Doughnut charts.
  • Several options for count and position of detached slices.
  • Customizable start angle.
  • Different label types.
  • Labels inside and outside pie segments.
  • Adjustment of position of labels inside pies.

Radar Charts

  • Polar charts.
  • Spider web background.
  • Three combinable appearance styles.
  • Pie-radar charts.
  • Custom labels inside and outside the chart.
  • Labels at chart segments.
  • Pens for all inner and outer axes.
  • Brushes for chart segments.
  • Custom-set background sections and brushes for them.
  • Customizable position of the inner axis.

Other Chart Types

  • Candlestick charts.
  • Bubble charts.
  • Scatter charts.

Gauge Types

  • Oval gauges.
  • Horizontal and vertical linear gauges.

Legend

  • Adjustable position and alignment.
  • Possibility to set the legend width.
  • Customizable background.
  • Custom-set font and brush for the labels.

Grid

  • Several different grid types.
  • Customizable grid width.
  • Custom-set pens at grid lines/stripes.
  • Custom-set pens/brushes for grid lines/stripes.
  • Grid labels with pointers at chart axes.

Programming

  • Numerous methods and properties for customizing the chart's appearance.
  • Strong design-time support to facilitate appearance customization.
  • Tested programming examples with all properties and methods.

User interaction

  • Pan and zoom.
  • Rotate pie and radar charts.
  • Hit testing.
  • Move the legend.

Output

  • Export bitmap images.
  • Print and print preview.
  • Export PDF files.
  • Export SVG drawings.

Appearance

  • Customize all pens and brushes.
  • Support for themes and a theme editor tool.
  • 3D charts.
  • Horizontal and vertical charts.
  • Customizable fonts.
  • Possibility to set the chart's position in bigger graphics.

Chart Data.

  • Set with numerical data arrays or through database.
  • Bind to XML documents.
  • Feed data to charts by implementing Series interface instead of copying values.
  • Custom annotations.
  • DateTime values supported through DateTimeSeries class.

Chart Axes

  • Several different types of labels.
  • Specify minimum and maximum axis values or auto scale.
  • Custom text.
  • Several rows/columns of labels for multi-graphics charts.
  • Division markers.
  • Several positions and orientations of axis labels.
  • Explanation labels.
  • Customize colors of all axis elements.