Fournisseur officiel
Comme nous somme les distributeurs officiels et autorisés, nous vous fournissons des licences légitimes directement à partir de 200+ éditeurs de logiciels.
Voyez toutes nos marques.
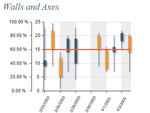
Captures d'écran : This screenshot demonstrates the following capabilities: adding synchronized detached axes; rotating axis labels. ...
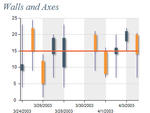
Captures d'écran : This screenshot demonstrates the following capabilities: using const lines; using stripes. ...
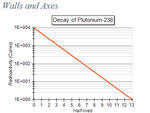
Captures d'écran : This screenshot demonstrates the following capabilities: using logarithmic scale; setting custom axis label format. ...
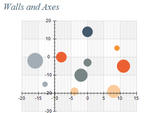
Captures d'écran : This screenshot demonstrates the following capabilities: using major and minor ticks; translating the coordinate system center; using major and minor grid lines. ...
Fonctionnalités : on your project and be able to customize every aspect of the appearance and behavior of the axis if needed. Multiple Axes Features This screenshot demonstrates the following capabilities: adding axes ... labels. Synchronized Detached Axes This screenshot demonstrates the following capabilities: adding synchronized detached axes; rotating axis labels. Const Lines and Stripes This screenshot demonstrates ... the following capabilities: using const lines; using stripes. Major and Minor Ticks This screenshot demonstrates the following capabilities: using major and minor ticks; translating the coordinate system center; ...
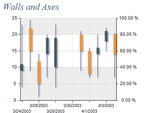
Captures d'écran : This screenshot demonstrates the following capabilities: adding axes to the left and to the right of the chart back wall; using different and, by need, synchronized scales; using grid lines ...
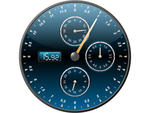
Captures d'écran : Layout combination of Radial Gauge, three radial sub-gauge areas and Numeric Display Panel. Demonstrates the parent radial layout feature that allows placement of child gauges at specified angle ...
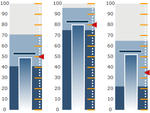
Captures d'écran : The example demonstrates Vertical Gauges with multiple indicators. ...
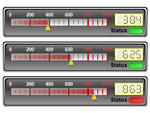
Captures d'écran : The example demonstrates combination of Linear Gauge, Numeric Display and State Indicator. ...
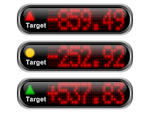
Captures d'écran : fashion with different styles. The example demonstrates combination of Numeric Display and State Indicator. ...
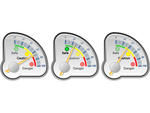
Captures d'écran : Gauge Indicators are showing important values, ranges or states on the gauge. Nevron Gauge can be used for the creation of complex gauges, KPIs, Scorecards and Dashboards. The example demonstrates ...
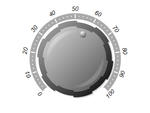
Captures d'écran : Gauge Indicators are showing important values, ranges or states on the gauge. Nevron Gauge can be used for the creation of complex gauges, KPIs, Scorecards and Dashboards. The example demonstrates ...
Fonctionnalités : Display Panel. Demonstrates the parent radial layout feature that allows placement of child gauges at specified angle and offset from center. Vertical Linear Gauge Linear Gauge displays axes, ranges ... and pointers in a linear fashion with different styles. Nevron Linear Gauge can be used for the creation of complex gauges, KPIs, Scorecards and Dashboards. The example demonstrates Vertical Gauges with multiple ... Scorecards and Dashboards. The example demonstrates combination of Linear Gauge, Numeric Display and State Indicator. Numeric Led Display Numeric displays are used to visualize a floating point value ...