Composants / JavaScript / HTML5 / Vizuly / Infragistics / Basic Primitives - Meilleures vendus

  1. Description : A single platform for enterprise app development for web, desktop, and mobile. Infragistics Professional includes 100+ beautifully styled, high-performance grids, charts, & other UI controls, plus time-saving productivity tools for developers. It ... Lire la suite

  2. Description : A single platform for UX design and enterprise app development for web, desktop, and mobile. Infragistics Ultimate includes 100+ beautifully styled, high-performance grids, charts, and other UI controls, plus visual configuration tooling, rapid ... Lire la suite

  3. $$$ | Acheter

    Description : Quickly build fast performing Web apps. Infragistics Ignite UI helps you build data-rich, responsive Web apps faster. It is a complete library of Enterprise-grade JavaScript UI components including native libraries for Angular, ASP.NET (Core and MVC), ... Lire la suite

  4. $$$ | Acheter

    Description : JavaScript/HTML/PDF Organizational Chart, Family & Dependencies Diagrams. Basic Primitives Diagram is a 100% JavaScript component library for building general purpose and organizational diagrams without manual nodes layout. It works in all major ... Lire la suite

  5. $ | Acheter

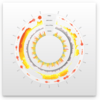
    Description : A radial line and area layout visualization. Vizuly Corona is a radial chart that provides angular and curved radial area line curves and supports both an overlap and stacked layout. It also features over a dozen different dynamic styles and comes bundled ... Lire la suite

  6. 6. Vizuly Halo Acheter maintenant

    Marque : Vizuly
    Catégorie principale : Composants des graphiques
    $ | Acheter

    Description : Represent transactional relationships from a specified number of sources to a variable number of targets. Vizuly Halo uses several different data visualization techniques to represent transactional relationships from a specified number of sources to a ... Lire la suite

  7. $ | Acheter

    Description : Represent cartesian x/y data within a radial plot. Vizuly Radial Bar is designed to represent cartesian x/y data within a radial plot. It supports both clustered and stacked radial bars Use the interactive style explorer on the left to view different ... Lire la suite

  8. $ | Acheter

    Description : Easily display multi-variate time series information. Vizuly Ring Chart lets you easily display multi-variate time series information. Due to its radial form factor, you can display 3 times the information for a given screen width than you could with a ... Lire la suite

  9. $ | Acheter

    Description : Add stacked and clustered bar charts to your JavaScript apps. Vizuly Bar Chart supports both stacked and clustered layout options, as well as over 2 dozen different dynamic styles. It also comes bundled with a test container and examples of different ... Lire la suite

  10. $ | Acheter

    Description : Add stacked and clustered column charts to your JavaScript apps. Vizuly Column Chart supports both stacked and clustered layout options, as well as over 2 dozen different dynamic styles. It also comes bundled with a test container and examples of ... Lire la suite