Chart Components News

RSS Feed

Compare Complex Data with Tornado Charts

February 19, 2026Product Update
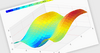
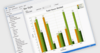
TeeChart for .NET 2026 adds a Tornado Chart series type for clear side-by-side comparisons and insightful sensitivity analysis in dashboards.

Deliver Advanced Charting with .NET 10 Support

February 17, 2026Product Update
.netCHARTING 10.8 brings its data visualization engine to the latest .NET platform, ensuring developers can build modern charting solutions.

Monitor Performance with Real-Time Linear Gauges

February 10, 2026Product Update
LightningChart JS v8.2 adds modern linear gauge charts that deliver real-time insights with flexible styling and adaptable dashboard layouts.

Identify Key Data Patterns with Trend Lines

February 4, 2026Feature Highlight
Trend lines reveal underlying patterns, clarify long-term trends, and turn chart data into clear, actionable insights for faster decision-making.

Export Chart Data to CSV from WinForms

February 2, 2026Feature Highlight
Give WinForms apps the ability to export charts to CSV format, making chart data available for use in reports, spreadsheets, and external systems.

Visualize Hierarchies with Dendrogram Charts

January 22, 2026Product Update
Highcharts 12.5 adds dendrogram support, enabling clear visualization of hierarchical structures and similarity relationships across complex data.

Add Keyboard Navigation to Charts in .NET

January 19, 2026Feature Highlight
Enhance chart accessibility in .NET applications by enabling keyboard navigation for smoother data exploration and improved user experience.

Discover Insights with Interactive Chart Zooming

January 16, 2026Feature Highlight
Examine critical data points more closely, reducing visual complexity and enabling accurate trend analysis across even the most complex datasets.

Easily Create Advanced Charts for Windows Apps

January 13, 2026Feature Highlight
Codejock Toolkit Pro delivers flexible charting and analysis capabilities that transform complex data into clear, actionable visual insights.

Compare Values Clearly with Range Charts

January 9, 2026Feature Highlight
Gain financial insights with range area charts that visualize value bands between two data points, revealing price ranges, projections, and trends.

Visualize Metrics Clearly in a Structured DataGrid

December 30, 2025Product Update
LightningChart Python v2.1 adds a new DataGrid that presents KPIs, metrics, and in-cell visual trends in a single, fully customizable view.

Improve Pie Chart Clarity with Side-Aligned Labels

December 29, 2025Product Update
ComponentOne Studio WinForms 2025 v2 enhances FlexPie with side aligned labels for cleaner visuals and improved readability.

Visualize Trends with Interactive Pivot Charts

December 23, 2025Feature Highlight
Pivot chart components in JavaScript UI suites simplify complex data visualization, providing flexible analytical capabilities.

Enable Real-Time Spreadsheet Collaboration

December 19, 2025Product Update
SpreadJS 19 adds support for collaborative work with a new server add-on that enables multiple users to edit the same spreadsheet simultaneously.

Show Progress with Goal-Driven Bullet Charts

December 18, 2025Feature Highlight
Compare budget, forecast, and actual values in a compact bullet chart to instantly spot variances and track progress toward targets with clarity.

Add Clarity to Charts with Animated Transitions

December 15, 2025Feature Highlight
Web Components charts with smooth animations make data changes easier to see and help users stay focused, even with complex visuals.

Visualize 3D Data with 2D Contour Charts for WPF

December 12, 2025Product Update
ComponentOne Studio Enterprise 2025 v2 elevates your WPF apps with high-performance contour mapping and gradient visualization capabilities.

Add Indicators to Highlight Trends in Blazor Charts

December 10, 2025Feature Highlight
Enhance data interpretation by overlaying calculated trends and thresholds directly onto your visualizations.

Instantly Show Latest Price on Financial Charts

December 5, 2025Product Update
LightningChart JS Trader v4.0 adds 'Latest Price' labels that highlight the most recent values to support more informed chart analysis.

Display Stock Data with OHLC Charts in .NET

December 2, 2025Feature Highlight
Enrich financial apps with high performance data visualization using OHLC (Open-High-Low-Close) charts to display price movements over time.