Fornitore ufficiale
In qualità di distributori ufficiali e autorizzati, forniamo licenze software legittime direttamente da più di 200 autori di software.
Vedi tutte le nostre marche

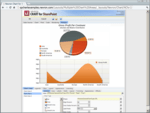
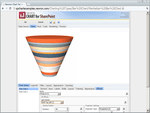
Descrizione: Funnel Charts are often used to represent stages in a sales process and show the amount of potential revenue for each stage. This type of chart can also be useful in identifying potential problem areas ... in an organization's sales processes. Radar Charts- available only in 2D The Chart Web Part Radar chart plots the values of each category along a separate axis that radiates from the center of the chart and ends ... markers, areas etc.). 2D Charting Nevron Chart for SharePoint is the only chart for SharePoint environment to provide Adobe Photoshop like image filter effects, which are applicable to all chart elements- ...

Descrizione: chart. Funnel Charts are often used to represent stages in a sales process and show the amount of potential revenue for each stage. This type of chart can also be useful in identifying potential problem ... for SharePoint is the only chart for SharePoint environment to provide Adobe Photoshop like image filter effects, which are applicable to all chart elements- these include bevel, emboss, lighting ... filters etc. When it comes to shadows it is the only chart for Share Point, which has soft shadows (based on Gaussian and Radial blur image filters). 2D/3D Consistency Nevron Chart for SharePoint is ...
Note di rilascio: of very complex SharePoint pages as the Nevron Chart/Gauge Web Part will defer the data aggregation and rendering tasks in separate AJAX requests to the server. This allows for faster data processing ... that fully utilizes your server capabilities, as separate AJAX requests can be handled by different threads of your server. It also helps the user to actually see what is currently being processed, opposed ... about the context of which they are performing the web part editing. Image Fill Style- A new Image Fill Style has been added to all Fill Style editors. This feature allows you to display image based ...

Schermate: or Flash). It does not use postbacks, MS ASP.NET controls or MS AJAX, which ensures that the client-server communication is brought to a minimum. The server-side UI processing is pure HTML and script ...
Note di rilascio: on who is viewing the Web part Field Filters as Parameters- Visually create complex dashboards with user driven parameters Rendering Improvements- The overall speed of the entire rendering process has been ...