Vizuly / dLSoft - I più venduti

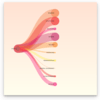
  1. 1. Vizuly Corona Acquista ora

    Marca: Vizuly
    Categoria principale: Componenti grafico
    $ | Compra

    Descrizione: A radial line and area layout visualization. Vizuly Corona is a radial chart that provides angular and curved radial area line curves and supports both an overlap and stacked layout. It also features over a dozen different dynamic styles and comes bundled ... Per saperne di più Visualizza altri risultati di questo prodotto

  2. Descrizione: Una visualizzazione del layout ad aree e della linea radiale. Vizuly Corona is a radial chart that provides angular and curved radial area line curves and supports both an overlap and stacked layout. It also features over a dozen different dynamic styles ... Per saperne di più

  3. $ | Compra

    Descrizione: Represent asymmetric hierarchical information in an easy to read visualization. Vizuly Weighted Tree nodes and branches can be dynamically sized and styled based on data bound properties that you set. One challenge with large hierarchal tree structures is ... Per saperne di più Visualizza altri risultati di questo prodotto

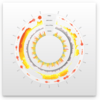
  4. Descrizione: Rappresenta informazioni gerarchiche asimmetriche in una visualizzazione di facile lettura. Vizuly Weighted Tree nodes and branches can be dynamically sized and styled based on data bound properties that you set. One challenge with large hierarchal tree ... Per saperne di più

  5. 3. Vizuly Halo Acquista ora

    Marca: Vizuly
    Categoria principale: Componenti grafico
    $ | Compra

    Descrizione: Represent transactional relationships from a specified number of sources to a variable number of targets. Vizuly Halo uses several different data visualization techniques to represent transactional relationships from a specified number of sources to a ... Per saperne di più Visualizza altri risultati di questo prodotto

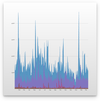
  6. Descrizione: Rappresenta le relazioni transazionali da un numero specificato di origini a un numero variabile di destinazioni. Vizuly Halo uses several different data visualization techniques to represent transactional relationships from a specified number of sources ... Per saperne di più

  7. 4. Vizuly Radial Bar Acquista ora

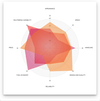
    Marca: Vizuly
    Categoria principale: Componenti grafico
    $ | Compra

    Descrizione: Represent cartesian x/y data within a radial plot. Vizuly Radial Bar is designed to represent cartesian x/y data within a radial plot. It supports both clustered and stacked radial bars Use the interactive style explorer on the left to view different ... Per saperne di più Visualizza altri risultati di questo prodotto

  8. Descrizione: Rappresenta i dati cartesiani x/y all'interno di un tracciato radiale. Vizuly Radial Bar is designed to represent cartesian x/y data within a radial plot. It supports both clustered and stacked radial bars Use the interactive style explorer on the ... Per saperne di più

  9. 5. Vizuly Ring Chart Acquista ora

    Marca: Vizuly
    Categoria principale: Componenti grafico
    $ | Compra

    Descrizione: Easily display multi-variate time series information. Vizuly Ring Chart lets you easily display multi-variate time series information. Due to its radial form factor, you can display 3 times the information for a given screen width than you could with a ... Per saperne di più Visualizza altri risultati di questo prodotto

  10. Descrizione: Visualizza facilmente le informazioni sulle serie temporali a più varianti. Vizuly Ring Chart lets you easily display multi-variate time series information. Due to its radial form factor, you can display 3 times the information for a given screen width ... Per saperne di più

  11. 6. Vizuly Bar Chart Acquista ora

    Marca: Vizuly
    Categoria principale: Componenti grafico
    $ | Compra

    Descrizione: Add stacked and clustered bar charts to your JavaScript apps. Vizuly Bar Chart supports both stacked and clustered layout options, as well as over 2 dozen different dynamic styles. It also comes bundled with a test container and examples of different ... Per saperne di più Visualizza altri risultati di questo prodotto

  12. Descrizione: Aggiungi grafici a barre impilati e raggruppati alle tue app JavaScript. Vizuly Bar Chart supports both stacked and clustered layout options, as well as over 2 dozen different dynamic styles. It also comes bundled with a test container and examples of ... Per saperne di più

  13. 7. Vizuly Column Chart Acquista ora

    Marca: Vizuly
    Categoria principale: Componenti grafico
    $ | Compra

    Descrizione: Add stacked and clustered column charts to your JavaScript apps. Vizuly Column Chart supports both stacked and clustered layout options, as well as over 2 dozen different dynamic styles. It also comes bundled with a test container and examples of ... Per saperne di più Visualizza altri risultati di questo prodotto

  14. Descrizione: Aggiungi grafici a colonne impilati e raggruppati alle tue app JavaScript. Vizuly Column Chart supports both stacked and clustered layout options, as well as over 2 dozen different dynamic styles. It also comes bundled with a test container and examples ... Per saperne di più

  15. $ | Compra

    Descrizione: Add line and area charts to your JavaScript apps. Vizuly Line Area Chart supports both line and area plots in several different layout options. It also comes bundled with a test container demonstrating the various chart properties and different style ... Per saperne di più Visualizza altri risultati di questo prodotto

  16. Descrizione: Aggiungi grafici a linee e ad area alle tue app JavaScript. Vizuly Line Area Chart supports both line and area plots in several different layout options. It also comes bundled with a test container demonstrating the various chart properties and different ... Per saperne di più

  17. 9. Vizuly Radar Chart Acquista ora

    Marca: Vizuly
    Categoria principale: Componenti grafico
    $ | Compra

    Descrizione: Add Radar charts to your JavaScript apps. Vizuly Radar Chart graphs multiple dimensions of one datum along multiple radial axis. Each plot represents 3 or more data points along shared axis lines. This chart supports highlighting of both individual data ... Per saperne di più Visualizza altri risultati di questo prodotto

  18. Descrizione: Aggiungi grafici radar alle tue app JavaScript. Vizuly Radar Chart graphs multiple dimensions of one datum along multiple radial axis. Each plot represents 3 or more data points along shared axis lines. This chart supports highlighting of both individual ... Per saperne di più

  19. $ | Compra

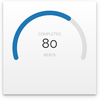
    Descrizione: Show numeric values within a minimum and maximum range. Vizuly Radial Progress is designed to show numeric values within a minimum and maximum range. It can also show when a value has exceeded the maximum threshold. This chart supports a variable range of ... Per saperne di più Visualizza altri risultati di questo prodotto

  20. Descrizione: Mostra i valori numerici all'interno di un intervallo minimo e massimo. Vizuly Radial Progress is designed to show numeric values within a minimum and maximum range. It can also show when a value has exceeded the maximum threshold. This chart ... Per saperne di più