WinForms 앱에 캔들스틱 차트를 추가하세요
캔들스틱 차트는 가격 변동, 시가/종가, 최고가/최저가를 시각적으로 보여주며 시장 심리와 트레이딩 기회를 파악할 수 있게 해줍니다.
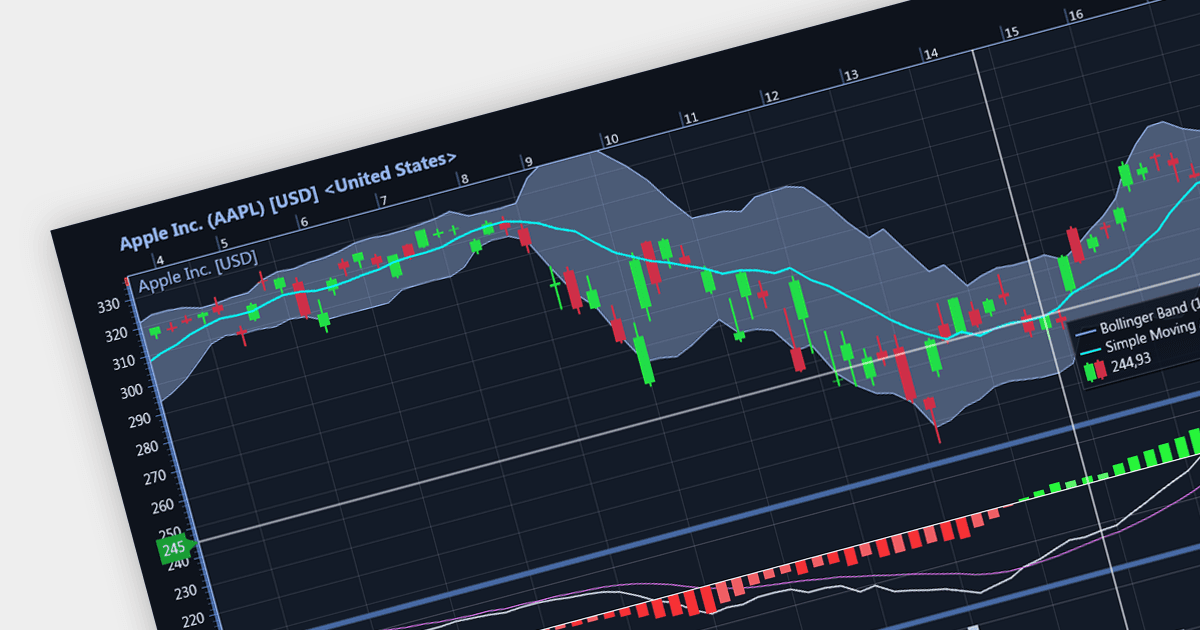
캔들스틱 차트는 유가증권, 파생상품 또는 통화의 가격 변동을 설명하는 데 사용되는 금융 차트의 한 유형입니다. 각 "캔들스틱"은 일반적으로 하루를 나타내며, 가운데의 "상자"는 시가와 종가 간의 범위를 나타내고 선은 최고가와 최저가를 보여줍니다. 이러한 독특한 시각적 형식은 트레이더가 시장 심리를 빠르게 이해하는 데 도움을 줍니다.
여러 WinForms 차트 컨트롤에서 캔들스틱 차트를 제공합니다. 예:
- DevExpress WinForms Chart (DevExpress WinForms의 일부)에서는 그림자부터 심지(wicks)까지 모든 캔들스틱 요소에 대한 정밀한 제어를 제공하여 기술적 분석에 이상적입니다.
- ComponentOne Charts for WinForms (ComponentOne Studio WinForms의 일부)에는 기본 제공 캔들스틱 템플릿과 금융 지표가 포함되어 있어 시장 분석 속도를 높여줍니다.
- Telerik Windows Forms ChartView (Telerik UI for WinForms의 일부)는 부드러운 확대/팬과 함께 간소화된 캔들스틱 렌더링을 제공하므로 역동적인 트레이딩 플랫폼에 적합합니다.
- Syncfusion WinForms Chart (Syncfusion Essential Studio Enterprise의 일부)에서는 광범위한 사용자 지정 옵션을 제공하여 캔들스틱을 트레이딩 요구에 맞게 조정할 수 있습니다.
- LightningChart .NET은 빠른 캔들스틱 업데이트로 시장을 앞서갈 수 있도록 해주며, 실시간 트레이딩 대시보드에 완벽합니다.
기능과 가격에 대한 심층 분석을 보려면 WinForms 차트 컨트롤 비교를 방문하세요.