차트 데이터의 추세를 설명하고 예측하세요
추세선은 차트 데이터에서 패턴을 파악하고 향후 움직임을 예측하는 데 도움이 되며, 다양한 분야에서 의사 결정을 지원합니다.
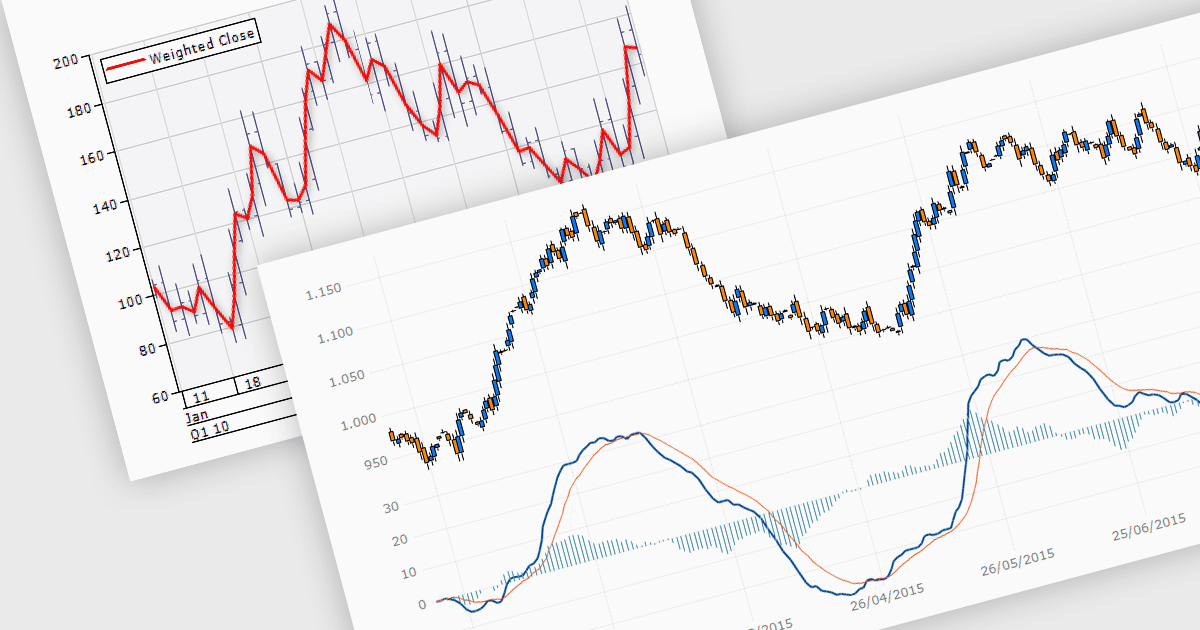
추세선은 데이터 시각화 및 재무 분석에서 필수적인 도구로, 데이터 집합의 추세 방향과 강도를 식별하고 해석하는 데 사용됩니다. 추세선은 차트에서 데이터를 가장 잘 대표하는 선으로, 지정된 기간 동안의 전반적인 방향을 강조합니다. 이는 정보에 입각한 의사 결정을 내리고 향후 가격 변동을 예측하며 진행 중인 추세의 강도를 검증하는 데 도움이 됩니다. 주식 시장 분석에서는 추세선이 투자자들이 최적의 진입 및 청산 시점을 파악하는 데 유용할 수 있으며, 이동평균은 매수 또는 매도 기회를 신호하여 트레이딩 전략의 효과를 높일 수 있습니다.
여러 .NET WinForms 차트 컨트롤에서는 추세선과 인디케이터를 제공합니다. 예:
- DevExpress WinForms Chart (DevExpress WinForms의 일부)는 향상된 데이터 해석을 위한 사용자 지정 추세선으로 정밀한 추세 분석을 지원합니다.
- ComponentOne Charts for WinForms (MESCIUS의 ComponentOne Studio WinForms Edition 일부)은 분석을 간소화하는 견고한 추세선 기능을 제공합니다.
- Nevron Chart for WinForms (Nevron Chart for .NET의 일부)는 상세한 예측에 이상적인 고급 추세선 기능을 제공합니다.
- TeeChart WinForms (Steema Software의 .NET용 TeeChart)는 여러 추세선의 사용을 가능하게 하여 차트에서 데이터 추세의 정확성과 명확성을 높입니다.
- Infragistics Windows Forms Charts (Infragistics Professional의 일부)를 통해 정교한 추세선을 통합할 수 있어 복잡한 데이터를 더 쉽게 분석할 수 있습니다.
기능과 가격에 대한 자세한 분석은 .NET WinForms 차트 컨트롤 비교를 참고하세요.